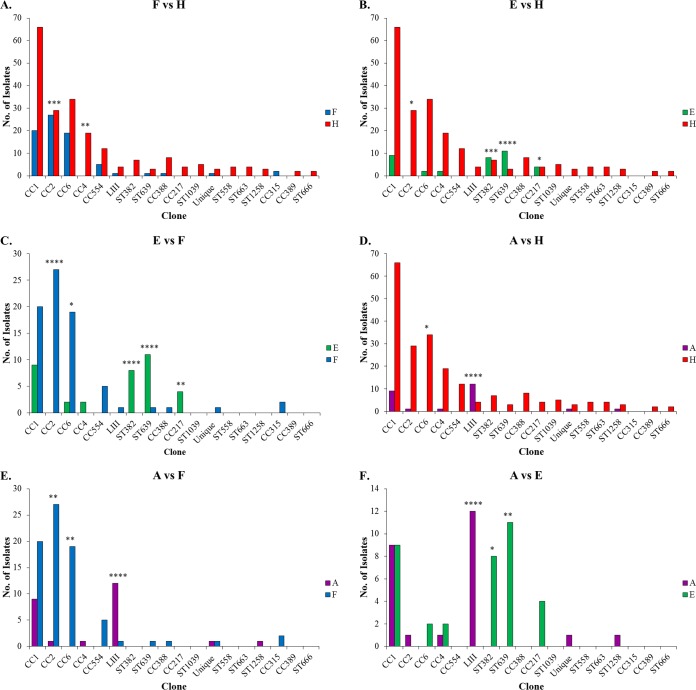
FIG 4 .
Numerical representation of each clone in pairwise comparisons between sources. Source comparisons are food versus human (A), environment versus human (B), environment versus food (C), animal versus human (D), animal versus food (E), and animal versus environment (F). Source designations, CC and ST designations, and the group designations “Unique” and “LIII” are as in Fig. 1. Significantly different distributions between sources are indicated with *, **, ***, and **** (P < 0.05, 0.01, 0.001, and 0.0001, respectively).

