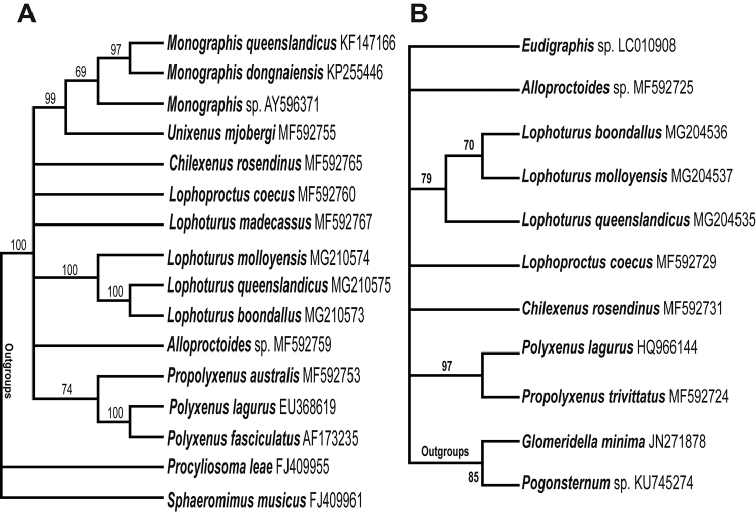
Figure 12.
The molecular phylogenetic analysis by maximum likelihood method. A A consensus tree of sequences from 18S marker generated by the bootstrap test (1000 replications and the support values >50% shown on the nodes) yielded a strongly supported phylogenetic tree B The maximum likelihood test of sequences from COI marker provided the molecular phylogenetic tree of evolutionary history between each species. Again, this tree supported all Lophoturus species in the same clade as in the result of 18S.

