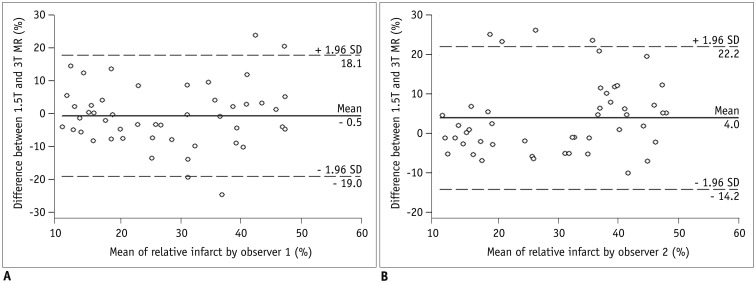
Fig. 4. Bland-Altman analysis of relative infarct area measured by observers 1 (A) and 2 (B).
Center line represents mean of differences, top line shows upper 95% limit of agreement, and bottom line shows lower 95% limit of agreement, with mean difference between long- and short-axis measurements (± 1.96 times SD).

