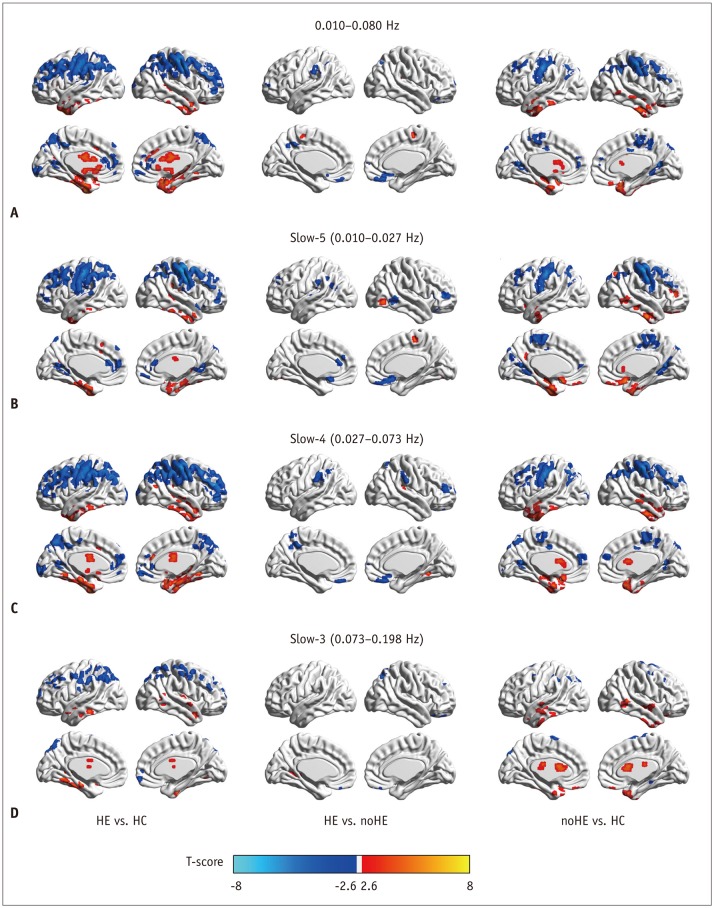
Fig. 2. Between-group regional homogeneity differences in routine analysis and in sub-frequency band analysis.
A. Two-sample t test result in 0.010−0.080 Hz. B. Two-sample t test result in slow-5 frequency band. C. Two-sample t test result in slow-4 frequency band. D. Two-sample t test result in slow-3 frequency band. HC = healthy control, HE = cirrhotic patients with clinical hepatic encephalopathy, noHE = cirrhotic patients without clinical hepatic encephalopathy

