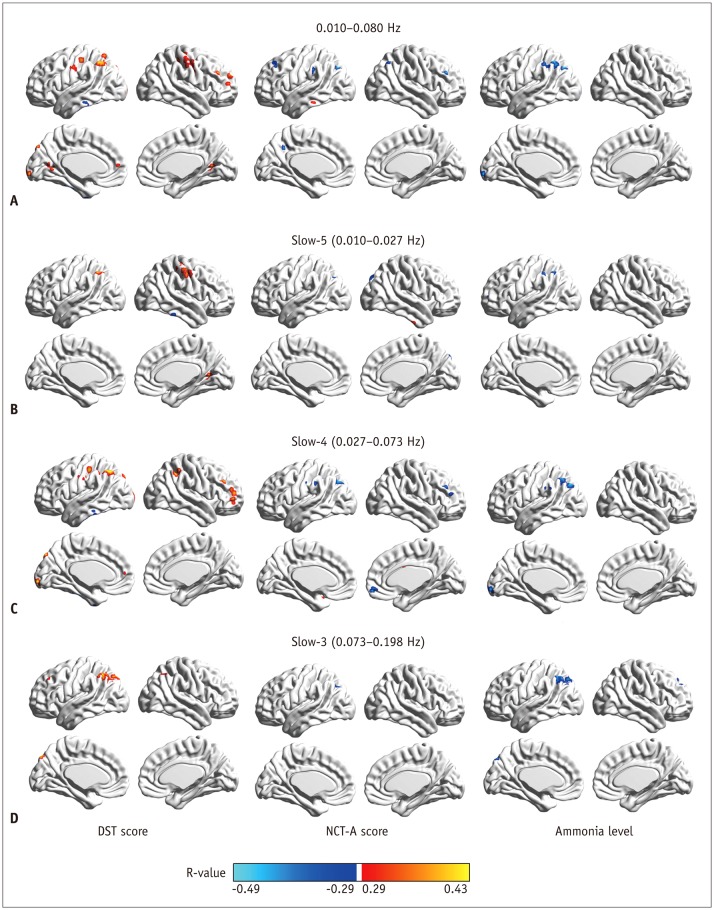
Fig. 3. Correlation of regional homogeneity values in group-difference regions with DST, NCT-A scores, and blood ammonia level.
A. Correlation map in 0.010−0.080 Hz. B. Correlation map in slow-5 band. C. Correlation map in slow-4 band. D. Correlation map in slow-3 band. DST = digit-symbol test, NCT-A = number connection test of type A

