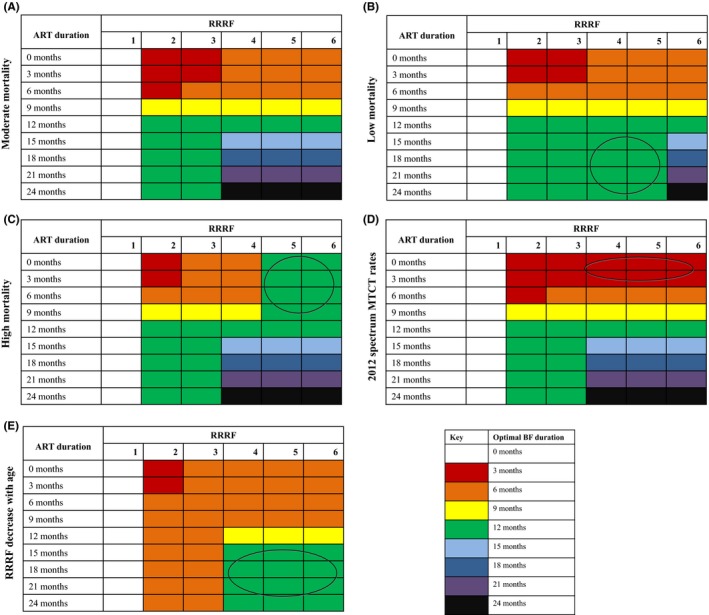
Figure 2.

Optimal breastfeeding duration for HIV‐exposed infants by RRRF value and maternal ART duration in various settings. This figure displays the breastfeeding duration that optimizes HIV‐free survival for each combination of RRRF value and ART duration. RRRF value varies across the horizontal axis, and maternal ART duration varies across the vertical axis. Colours correspond to different breastfeeding durations, as described in the figure key. Circles indicate differences in optimal breastfeeding duration compared to the base case. (A) Results for “moderate mortality” scenario. (B) Results for “low mortality” scenario, using 25th percentile values of neonatal, infant, and under‐five mortality estimates from 21 Global Plan countries. (C) Results for “high mortality” scenario, using 75th percentile values of neonatal, infant, and under‐five mortality estimates from 21 Global Plan countries. (D) Results using MTCT rates used in the 2012 Spectrum model. Results using Spectrum 2016 rates are similar and are shown in Material S5. (E) Results for scenarios in which RRRF is reduced as children age. RRRF impact was reduced by 50% for infants who reach 12 months of age, and was again reduced by 50% for infants at 18 months of age. RRRF, relative risk of replacement feeding; BF, breastfeeding; ART, antiretroviral therapy.
