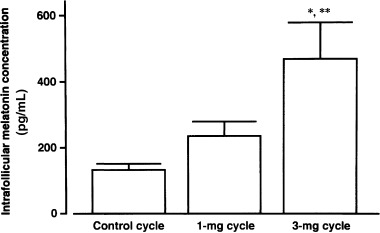
Figure 2.

Intrafollicular melatonin concentrations in the control, the 1 mg, and the 3 mg cycles of nine subjects. Values are mean ± SEM of nine subjects. Data were analyzed by Duncan's new multiple range test. *P < 0.01, **P < 0.05, compared with the control cycle and the 1 mg cycle, respectively.
