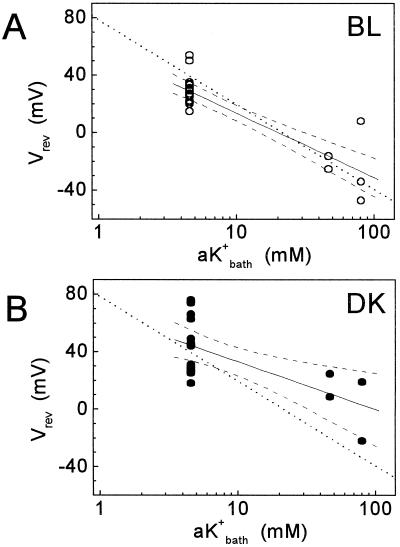
Figure 3.
The cell membrane and the channels in the patch are K+ selective. Reversal potentials under the first BL (A) and under the first DK treatment (B) are plotted versus three bath K+ activities. The dotted lines describe the equation: Vrev = −59 log10(aK+bath/aK+pip) where aK+ = K+ activity, bath and pip denote the bath and the pipette solutions, respectively, and aK+pip = 21.5 mm, corresponding to K+ concentration of 25 mm. The solid lines are linear fit to Y = a + b log10(aK+bath); R is the coefficient of correlation; n, the number of data points; P, probability that R = 0. The dashed lines are the 95% confidence limits of the fit (Microcal Software Inc., Northampton, MA). The values of the fit were: for BL, a = 58.3 ± 5.5 mV; b = −44.7 ± 5.4; R = −0.86835; P < 0.0001; n = 24; for DK, a = 66.4 ± 10 mV; b = −33.2 ± 10; R = −0.61649; P = 0.00379; n = 20. The mean values of the experimentally determined Vrev were (under BL and DK, respectively): at bath concentration of 5 mm, 28.8 ± 2.2 mV and 44.3 ± 5.1 mV; at 55 mm, −20.9 ± 4.5 mV and 16.6 ± 8.0 mV; at 105 mm, −24.3 ± 16.6 mV and −1.5 ± 20.5 mV.

