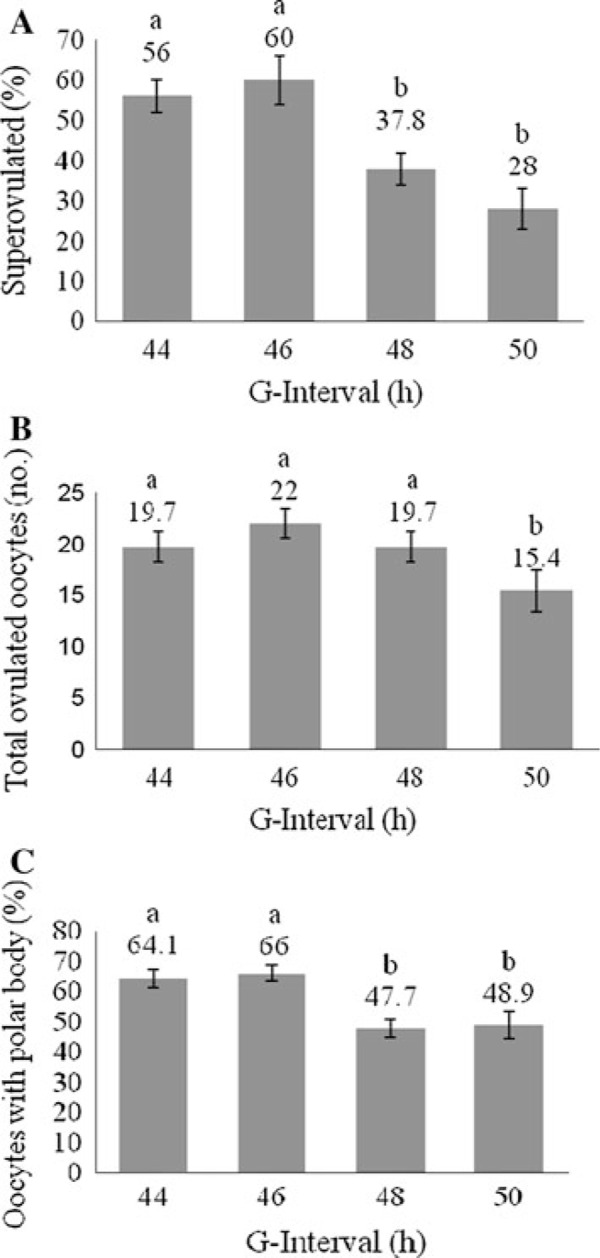
Figure 2.

Results of superovulation with the effect of different gonadotropin intervals in BALB/cJ mice. a Percentages of superovulated mice (5–11 replications and 5 females per replication). b The number of total ovulated oocytes per mouse. c The percentage of oocytes without polar bodies per mouse. Values are expressed as (mean ± SEM). Columns with different superscripts are significantly different (p < 0.05)
