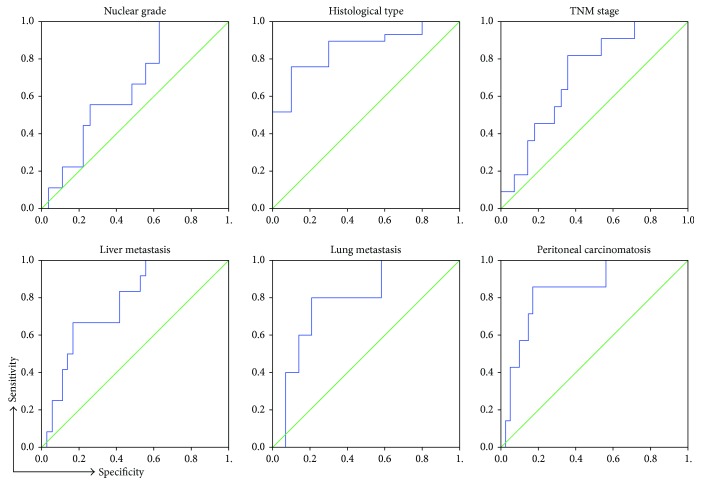
Figure 4.
Specificity and sensitivity of fecal Gal-3. ROC curves illustrate the specificity and sensitivity of fecal Gal-3 comparing nuclear grade, histological type of tumor tissue (well/moderate versus poor differentiated), TNM stage (I + II versus III + IV), presence of liver metastasis (+ versus −), lung metastasis (+ versus −), and peritoneal carcinomatosis (+ versus −).

