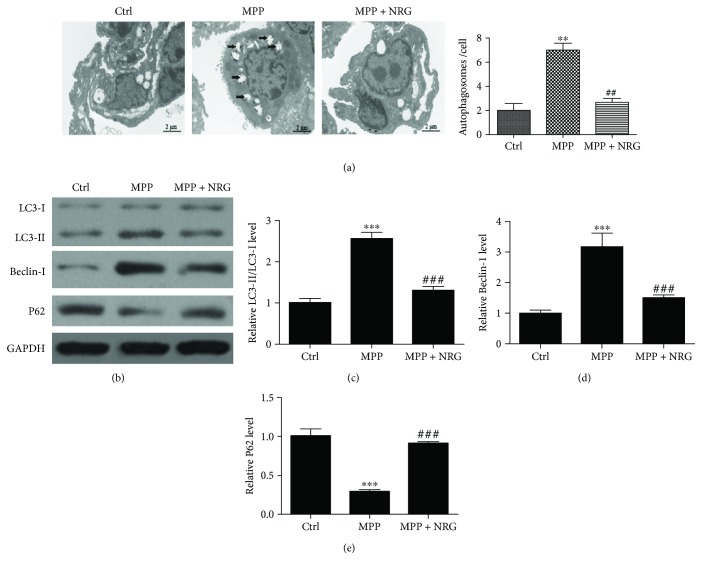
Figure 2.
NRG treatment decreased M. pneumonia-induced autophagy. (a) TEM shows the autophagosome in lung tissues. Data are presented as the mean ± SD with Tukey–Kramer multiple comparison test analysis. n = 10. ∗∗P < 0.01 versus ctrl group; ##P < 0.01 versus MPP group. (b) Western blot detection shows the expression of autophagy relative protein LC3, P62, and Beclin-1. (c–e) The results are expressed as relative ratios of band density of LC3-II/LC3-I (c), Beclin-1 (d), and P62 (e). Data are presented as the mean ± SD with Tukey–Kramer multiple comparison test analysis. n = 3. ∗∗∗P < 0.001 versus ctrl group; ###P < 0.001 versus MPP group.

