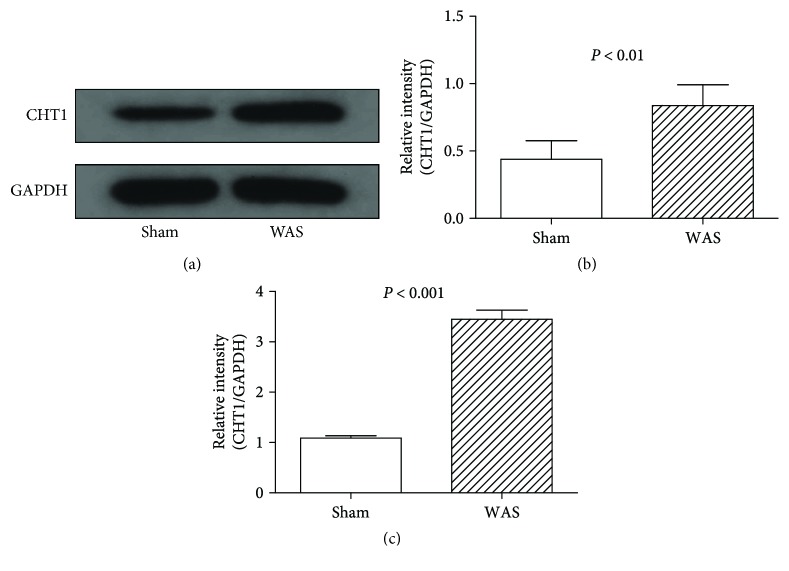
Figure 3.
Western blotting and quantitative RT-PCR analysis of CHT1 expression in dorsal root ganglion (DRG). (a) Representative Western blotting for CHT1 in colonic DRGs. (b) Levels of CHT1 protein measured by Western blotting analysis. P < 0.01 by two-sample t-test, n = 6 per group. (c) Levels of CHT1 expression measured by quantitative RT-PCR. P < 0.001 by two-sample t-test, n = 6 per group.

