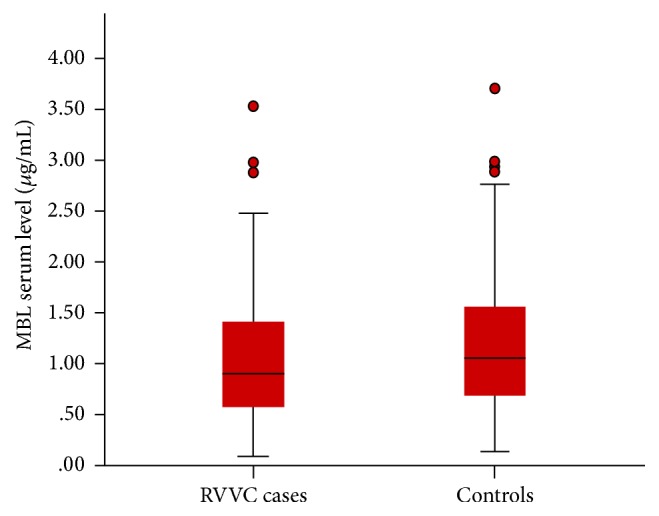
Figure 1.

Box plot showing the difference between RVVC cases (n = 59) and controls (n = 59) regarding MBL serum level. The median MBL serum level of RVVC cases was nonsignificantly lower than that of controls (P = 0.145). The upper and lower ends of boxes and inner lines correspond to the upper and lower quartiles and median values, respectively. Whiskers indicate minimum and maximum values, and circles denote outliers.
