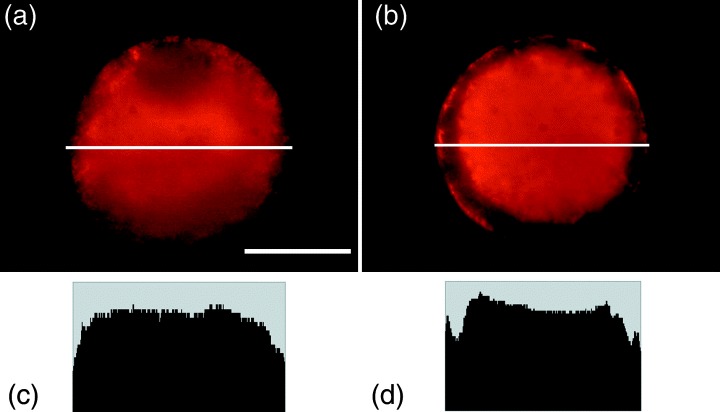
Figure 4.

Fluorescent micrographs showing two distribution patterns of mitochondria by MitoTracker Red: (a) ‘Even’ and (b) ‘peripheral free’. Histograma show pixel strength of the equatorial plane of the oocyte (a white line in the figure). (c) ‘Even’ and (d) ‘peripheral free’. See text for the explanation. Bar represents 50 µm in (a).
