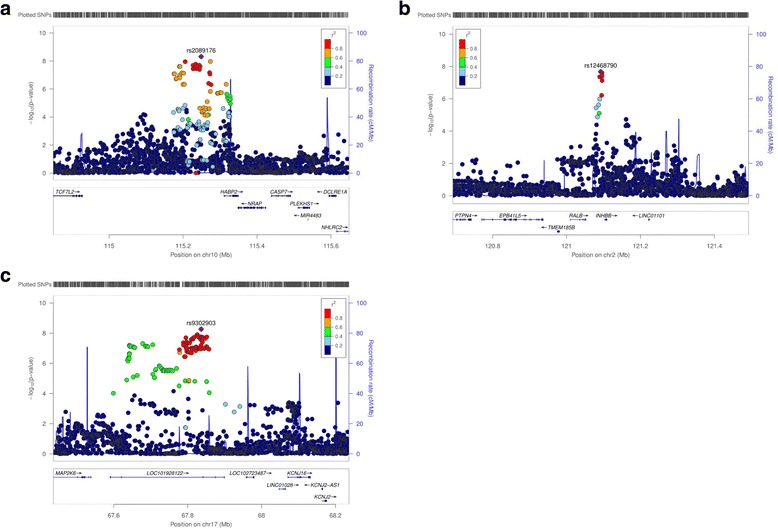
Fig. 1.

Regional association plots for newly identified mammographic density loci. Regional plots of single-nucleotide polymorphisms (SNPs) associated with volumetric mammographic density measures. Lead SNPs are shown in purple: A = percent dense volume (rs2089176); B = absolute dense volume (rs12468790); C = absolute dense volume (rs9302903). Circles denote imputed SNPs; squares denote genotyped SNPs. Colors indicate the extent of linkage disequilibrium. Genetic recombination rates are estimated using 1000 Genomes EUR sample and are presented as the light blue line. Physical positions are based on NCBI Genome Reference Consortium Human Build 37 (GRCh37). Plots were generated using LocusZoom [20]. LOC101928122 stands for LINC01483
