Fig. 1.

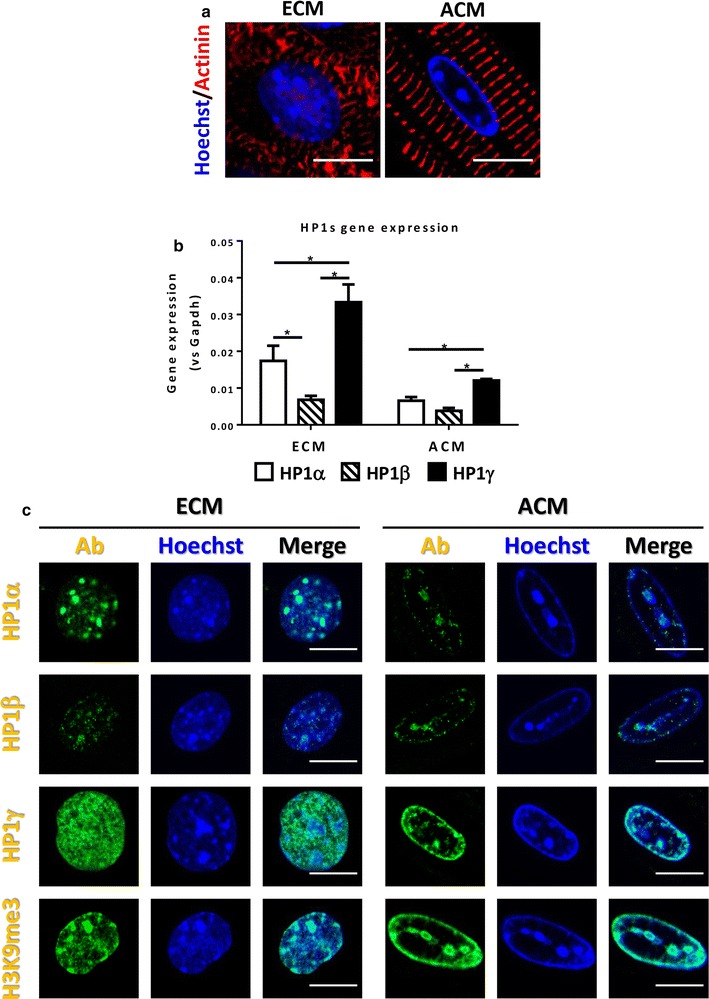
Characterization of HP1s in cardiac development. a Heterochromatin accumulation during cardiac development. Heterochromatin was visualized by Hoechst staining (Blue) and CM-specific maker α-actinin was immunostained (Red). Scale bar indicates 10 μm. b Comparison of HP1s gene expression. Total RNA was isolated from purified ECM and ACM. Gene expression levels were measured by using isoform-specific primer sets for qPCR following reverse transcription. Expression levels were compared to GAPDH gene expression. *p < 0.05. c Localization of HP1s in CMs. ECMs and ACMs were isolated and HP1s and H3K9me3 were stained using specific antibodies (Green). DNA was stained with Hoechst to visualize heterochromatin foci (Blue). Scale bar indicates 10 μm
