
Fig. 7.
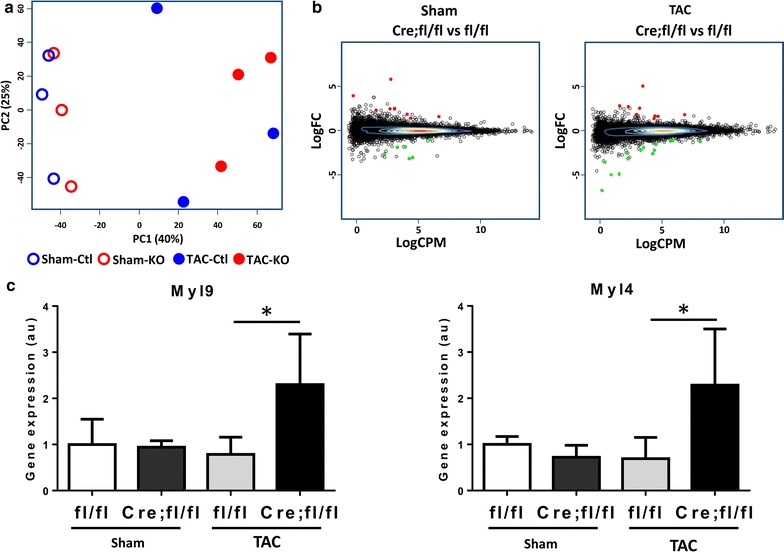
Effect of HP1γ KO on TAC-induced differential gene expression. a Principle component analysis. RNA-seq was performed purified CMs after TAC. Three independent biological samples were used for each group: Sham-control (fl/fl), Sham-HP1γ KO (Cre;fl/fl), TAC-control and TAC-HP1γ KO. b MA plot. Y-axis shows fold change of gene expression in HP1γ KO (Cre;fl/fl) vs control (fl/fl). X-axis shows average of count per million in all samples. Significantly, differentially expressed genes are shown in color (up regulation in red and down regulation in green). c RT-qPCR validation. Uniquely upregulated genes in HP1γ KO only after TAC were confirmed by RT-qPCR. *p < 0.05