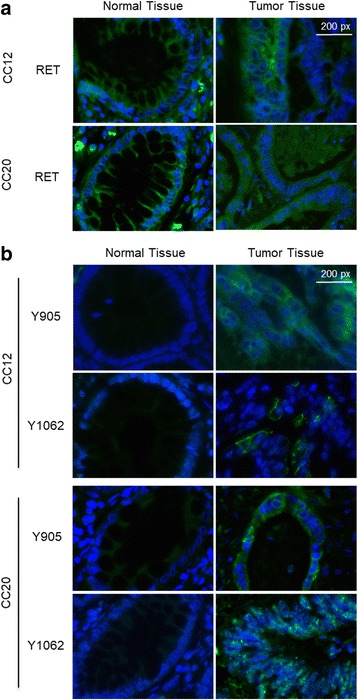
Fig. 3.

Immunofluorescence analysis of RET expression and phosphorylation in colon cancer samples. a. Immunofluorescence analysis of RET expression in normal and tumor tissue samples from patients CC12 and CC20 shown as merged images of green (RET staining) and blue (DAPI staining). Magnification 63X. Scale bar, 200px. b. Immunofluorescence analysis of RET phosphorylation at Y905 and Y1062 in normal and tumor tissue samples from patients CC12 and CC20 shown as merged images of green (phospho-RET staining) and blue (DAPI staining). Magnification 63X. Scale bar 200px
