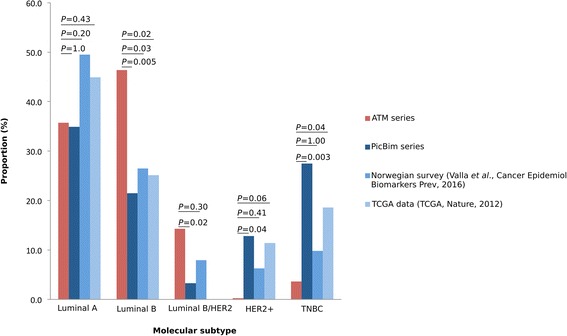
Fig. 1.

Distribution of molecular subtypes in the ataxia-telangiectasia mutated (ATM) series and in the three control series. PAM50 classification was used for The Cancer Genome Atlas (TCGA) data, which explains the absence of luminal B/Human epidermal growth factor receptor 2-positive (HER2+) tumours in this series. Fisher’s exact test was used to assess difference between ATM series and control series. PICBIM Programme incitatif et collaboratif - Cancer du sein: invasion et motilité series
