Fig. 5.

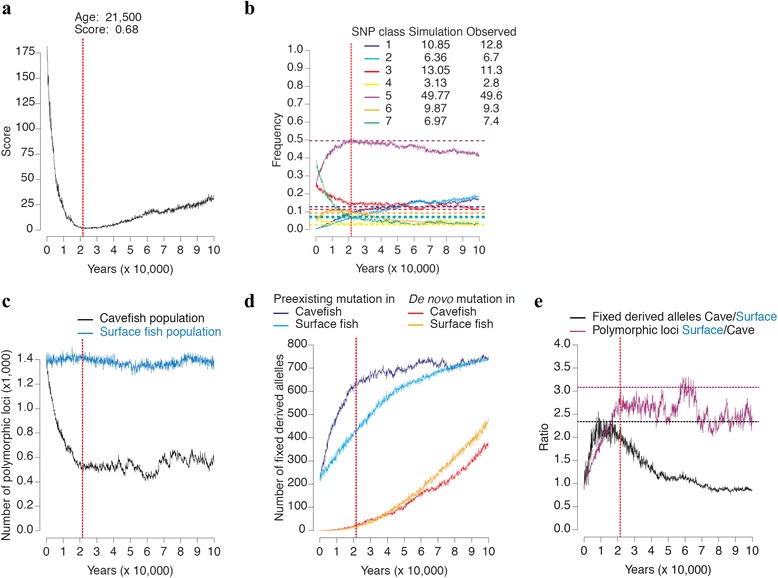
Goodness of fit to the data. The model parameters are: SF population size = 10,000; CF population size = 625; % migrants from surface to cave = 0.1; migration rate from surface to cave = 0.001 / year; SF generation time = 2 years; CF generation time = 5 years; lab population parameters: 10 fish, 10 generations. a Score of goodness of fit according to the age of the cave population, the best fit is when the cavefish population is 21,500 years old. b Evolution of the SNP class frequencies during the simulation. Horizontal dotted lines are the observed SNP class frequencies. Observed and simulated frequencies at the age of the best fit are shown in the top right corner. c Evolution of the number of polymorphic sites in SF and CF during the simulation. d Evolution of the number of derived alleles that were fixed in SF and CF during the simulation. e Evolution of the SF/CF polymorphism ratio and the CF/SF derived allele ratio that reached fixation during the simulation. Horizontal dotted lines are the observed ratios. The vertical dotted line is the age of the cavefish population for which the best fit was observed
