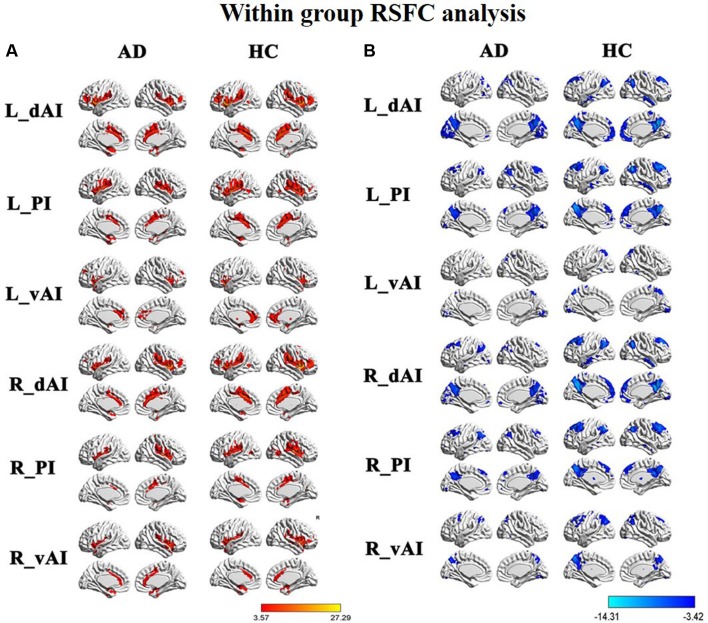
FIGURE 2.
Within group resting-state functional connectivity (RSFC) analysis, (A) The positive RSFC patterns of the insular subregions in each group including healthy controls (HCs) and Alzheimer’s disease (AD) patients [P < 0.05, false discovery rate (FDR) corrected]; (B) the negative RSFC patterns of the insular subregions in each group including healthy controls and AD patients [P < 0.05, FDR corrected].

