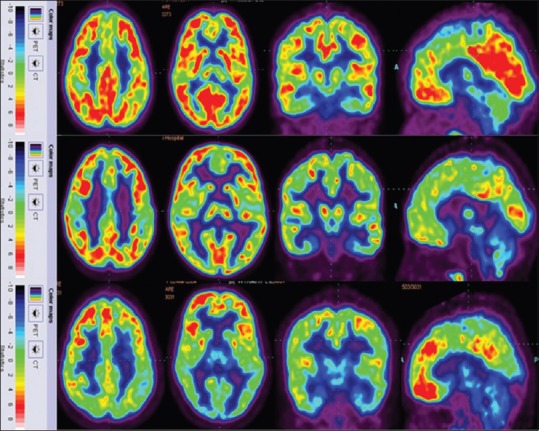
Figure 3.

[18F] 2-fluoro-2-deoxy-D-glucose-positron emission tomography image of the autism group top row indicates, a 4-year-old boy showing hypometabolism in hippocampus; middle row indicates an 8-year-old boy showing hypometabolism in cerebellum, thalamus, amygdala, hippocampus, and parahippocampal gyrus; bottom row indicates a 12-year-old boy showing hypometabolism in cerebellum, thalamus, amygdala, hippocampus, and parahippocampal gyrus
