Figure 3.
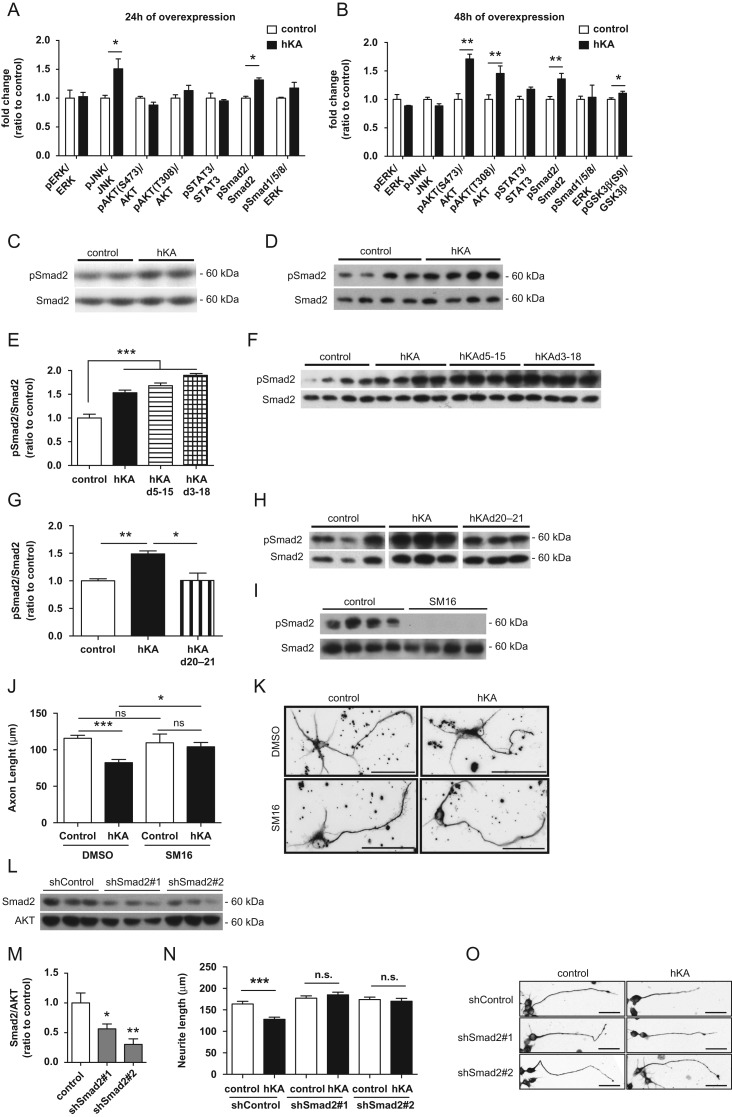
KIAA0319 inhibits axon growth through Smad2 activation. (A, B) Quantification of the ratios of phosphorylated/total ERK (pERK/ERK), JNK (pJNK/JNK), AKT (pAKT(S473)/AKT and pAKT(T308)/AKT), STAT3 (pSTAT3/STAT3), Smad2 (pSmad2/Smad2), Smad1/5/8 (Smad1/5/8/AKT), and GSK3β (pGSK3βS9/GSK3) as determined by western blot of CAD cell lysates collected either 24 h (A), or 48 h (B) after transfection with full-length WT human KIAA0319 (hKA); controls were CAD cells transfected with empty plasmid. (C, D) Representative anti-pSmad2 and anti-total Smad2 western blots 24 h (C) and 48 h (D) post-transfection of CAD cells with full-length WT human KIAA0319 (hKA). (E–G) Quantification of pSmad2 and Smad2 48 h post-transfection of CAD cells with either hKA or KIAA0319 mutants lacking the PKD domains (hKAd5-15) (E), the whole extracellular domain (hKAd3-18) (F), or a KIAA0319 mutant lacking the cytosolic domain (hKAd20-21) (G). (F–H) Representative western blots of E (F) and G (H). (I) Western blots of pSmad2 and total Smad2 in hippocampal neurons treated either with TGF-βRI inhibitor SM16 (SM16) or with vehicle DMSO (control). (J) Quantification of axon length in I; DMSO (control: n = 83; hKA: n = 64 neurons) or SM16 (control: n = 30; hKA: n = 44 neurons). (K) Representative images of βIII-tubulin immunofluorescence of GFP-positive hippocampal neurons transfected with either hKA or empty vector (control) and grown in the presence of SM16 or DMSO. Scale bar, 50 μm. (L) Western blot analysis of Smad2 levels in CAD cells transfected with shRNAs against Smad2 (shSmad2#1 and shSmad2#2) or a control plasmid (shControl). (M) Quantification of L. (N) Quantification of neurite length in CAD cells transfected with a control shRNA or specific shRNAs against Smad2 (shSmad2#1 and shSmad2#2) and overexpressing either KIAA0319 (hKA) or an empty vector (control); shControl (control: n = 143; hKA: n = 186 cells), shSmad2#1 (control: n = 155; hKA: n = 169 cells) and shSmad2#2 (control: n = 153; hKA: n = 104 cells). (O) Representative photomicrographs of βIII-tubulin immunofluorescence images of differentiated CAD cells transfected with either a control shRNA plasmid (shControl) and 2 shRNA against Smad2 (shSmad2#1 and shSmad2#2) and overexpressing either KIAA0319 (hKA) or an empty vector (control). Scale bar, 50 μm. Results are expressed in mean ± SEM. *P < 0.05, **P < 0.01, ***P < 0.001; ns, nonsignificant.

