Figure 6.
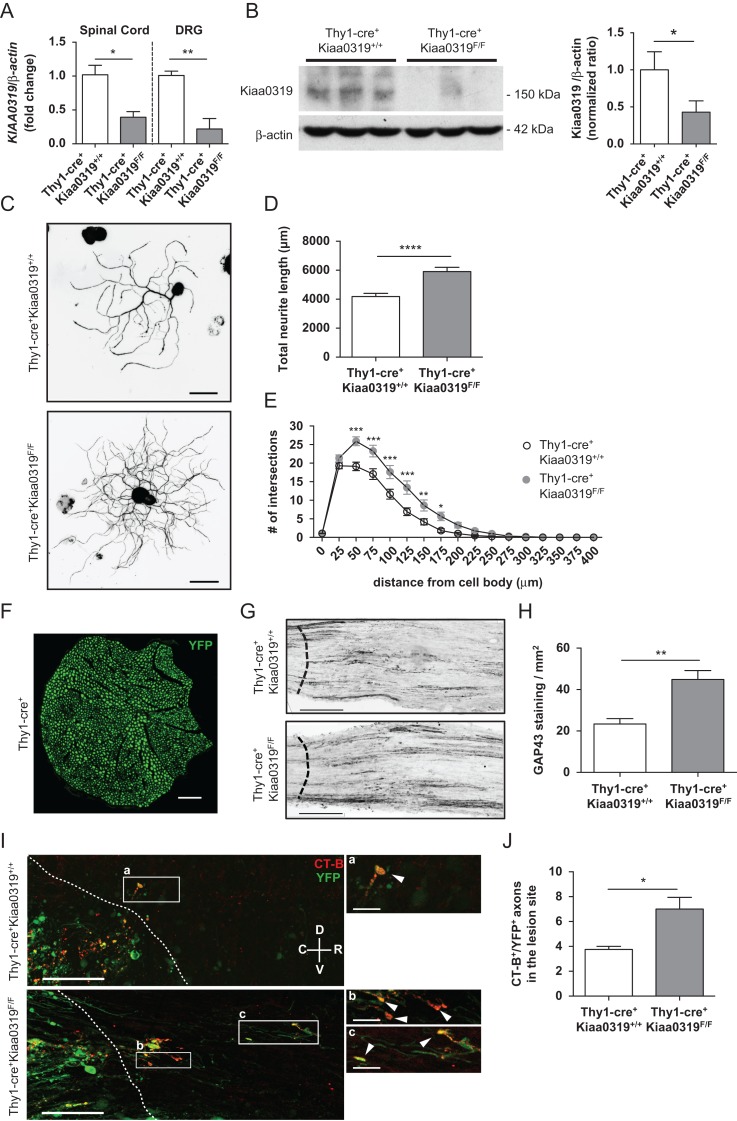
Deletion of Kiaa0319 increases axon growth. (A) qPCR analysis of Kiaa0319 in the spinal cord and DRG of Thy1-cre+Kiaa0319+/+ and Thy1-cre+Kiaa0319F/F animals. (B) Western blot analysis of KIAA0319 (left) and respective quantification (right) in spinal cord lysates of Thy1-cre+Kiaa0319+/+ and Thy1-cre+Kiaa0319F/F animals. (C) Representative photomicrographs of anti-βIII-tubulin staining of YFP-positive DRG neurons isolated from adult Thy1-cre+Kiaa0319+/+ and Thy1-cre+Kiaa0319F/F mice plated on laminin and grown for 12 h. Scale bar, 50 μm. (D) Quantification of the total neurite length of C. (E) Sholl analysis of DRG neurons from Thy1-cre+Kiaa0319+/+ and Thy1-cre+Kiaa0319F/F animals. (F) Representative photomicrographs of Thy1-Cre+ mice sciatic nerve in transverse section. Scale bar, 500 μm. (G) GAP43 staining in sciatic nerves of Thy1-cre+Kiaa0319+/+ and Thy1-cre+Kiaa0319F/F mice isolated 3 days after sciatic nerve crush. The dashed line indicates the lesion border. Scale bar, 200 μm. (H) Quantification of F (n = 5 each genotype). (I) Representative photomicrographs of CT-B staining in spinal cords of Thy1-cre+Kiaa0319+/+ and Thy1-cre+Kiaa0319F/F mice after dorsal column hemisection. The dashed line indicates the lesion border; C, caudal; R, rostral; V, ventral; D, dorsal. Scale bar, 100 μm. A higher magnification of the boxed regions (a–c) is shown in the right panels. Arrowheads highlight CT-B+ (red)/ YFP+ (green) axons. Scale bar, 25 μm. (J) Quantification of the average number of axons within the glial scar in Thy1-cre+Kiaa0319+/+ and Thy1-cre+Kiaa0319F/F mice (n = 8 each genotype). Results are expressed in mean ± SEM. *P < 0.05, **P < 0.01, ***P < 0.001, ****P < 0.0001.

