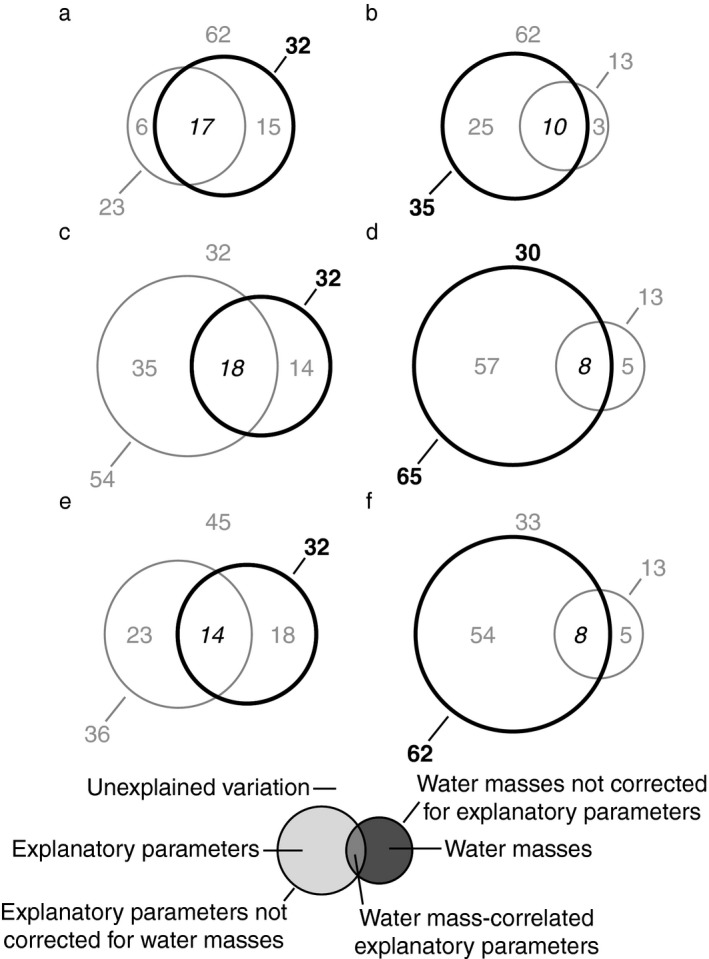
Figure 5.

Variation partitioning of graph link efficiency. The figure shows the percentage of the variation in graph link efficiency relative to controls that is explained by water‐mass defining parameters (temperature, salinity) correct and uncorrected for explanatory parameters, explanatory parameters corrected and uncorrected for the influence of water masses, water‐mass correlated explanatory parameters, and that remains unexplained after 24 h (a, c, e) and 72 h (b, d, f) of incubation. Explanatory parameters were prokaryotic leucine incubation, prokaryotic and viral abundance (a, b), the frequency of infected cells (c, d), and viral production (e, f). Data from single source transplantation and mixing treatments were analyzed together. Statistically significant values are in bold, insignificant values are in gray, and values that cannot be tested for statistical significance are in italics.
