
Figure 2.
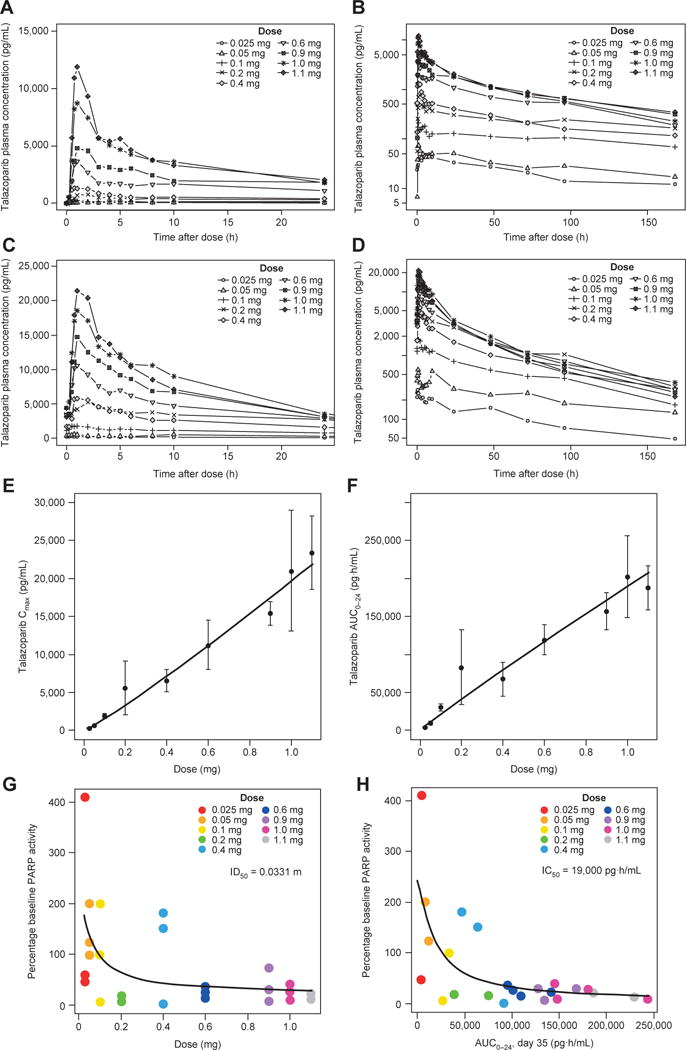
PK and PD features of talazoparib. A–D, Mean concentration– time profiles of talazoparib. Linear mean talazoparib plasma concentration–time profiles over the initial 24 hours after dose and log-linear mean talazoparib plasma concentration–time profiles over the complete sampling interval following (A and B) single doses of talazoparib and (C and D) multiple daily doses of talazoparib. E–H, Dose proportionality of talazoparib PK and dose–response and exposure–response relationships between talazoparib and PBMC PARP activity. E, Plasma Cmax following multiple daily doses ranging from 0.025 to 1.1 mg. F, AUC0–24 following multiple daily doses ranging from 0.025 to 1.1 mg. Filled circles represent the mean value at each dose level, and error bars represent the standard deviations. Solid line represents the power model fit through the data. G, Dose–response relationship between talazoparib and PBMC PARP activity. H, Exposure–response relationship between talazoparib and PBMC PARP activity. Percentage baseline PBMC PARP activity defined as the mean of the predose PARP activity assessments during the multiple dosing assessment phase (i.e., predose assessments on days 15, 22, and 35 of cycle 1). Abbreviations: AUC0–24, AUC from 0 to 24 h; IC50, half maximal inhibitory concentration; ID50, inhibitory dose 50%; PD, pharmacodynamic.