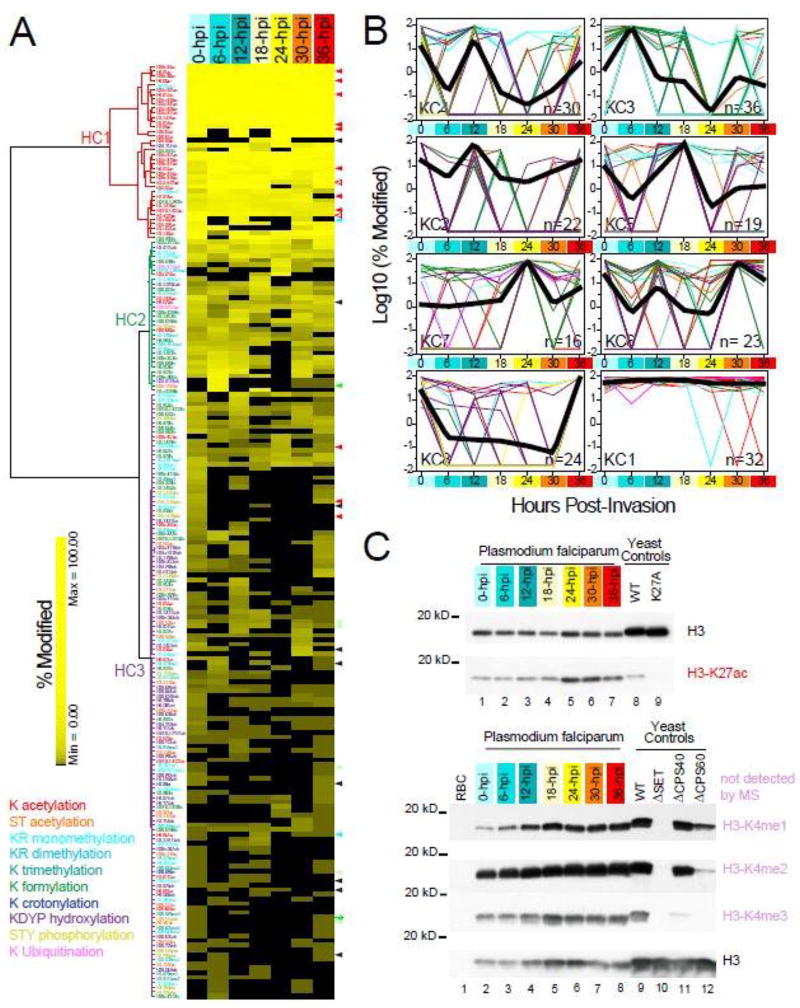
Figure 3. Dynamic landscape of PTM levels across seven erythrocytic stages of P. falciparum.
A. Unsupervised hierarchical clustering analyses of histone PTMs. SpC-based modification levels (SI-4.2) are hierarchically clustered (SI-5.1) with Euclidean as the distance metric and Ward’s method with multiple-fragment heuristic algorithm (MF) as a seriation rule. For each of the 202 quantified histone PTMs (rows), the color intensity is proportional to the modification level (%) measured in each stage (columns). PTM types are color-coded as in Fig. 2 and the dendrogram line colors denote the modification type that is the most represented in each cluster. An expanded version of this heat map is provided in Fig. S3.
B. k-means clustering of histone PTMs. Histone modifications optimally separate into eight k-means clusters using the Hartigan-Wong algorithm on their spectral count-based abundance during the IDC (SI-5.2). For each histone PTM, abundance values for the seven time points are expressed as the percentage of the maximum measured value for this PTM at any time point during the IDC. For each k-means cluster, log10 values of the average normalized modification level are plotted as a function of hours post-invasion (SI-5.1). Clusters are ordered based on the time point at which their maximum modification levels are measured (from 0 to 36-hpi), with cluster KC1 containing PTMs detected at near maximum levels across all seven time points. The number of PTMs in each cluster in indicated in the bottom right corner. The temporal profile of each individual PTMs is represented by lines color-coded by modification type, while thick black lines represent the result of multiple curves averaging.
C. Validation of mass-spectrometry results by Western blot. Acetylation at H3-K27 and the three methylation states of H3-K4 are detected at seven time points of the parasite cell cycle using antibodies against the conserved modifications in S. cerevisiae. Whole cell extracts from wild-type yeast, a strain expressing the H3-K27A mutant, and yeast strains deficient in the H3-K4 methylating machinery are analyzed in parallel to ensure proper behavior of each antibody.
Loading amounts in each lane are normalized using an antibody against Saccharomyces cerevisiae histone H3. K27ac levels in both H3 isoforms as measured by our MS analysis of the seven time points are indicated by the open red arrowheads on the right side of the heat map in A. While the peptide bearing H3-K4 was not detected by MS, mono-, di- ant tri-methylation of this residue are present at all stages of the parasite cell cycle, hence behaving similarly to H3-K27ac. An additional 30 PTMs are validated by MRM assays (SI-6.2), as indicated by arrowheads on the right side of the heat map in A. These arrowheads are color-coded by novelty status as in Fig.1A/S1.

