Figure 2.
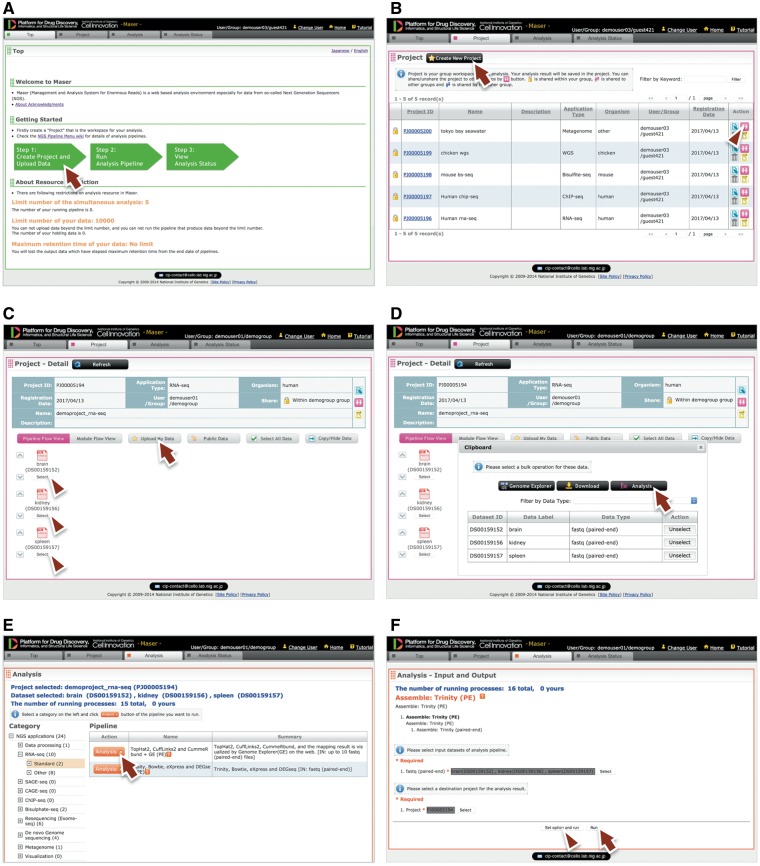
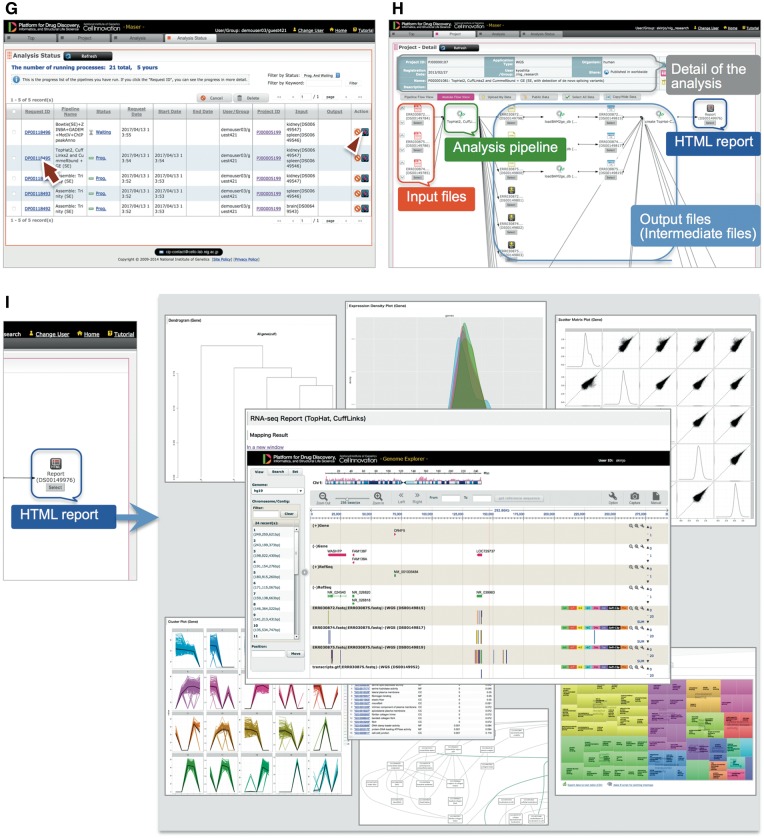
Maser web interface. (A) Maser front page. Three green block arrows indicate the main steps to start the analysis. Step 1: Create project and upload data (red arrow), Step 2: Run analysis pipeline, Step 3: View analysis status. (B) Project page. Arrow indicates button to create new project and arrowhead indicates icon to share the project with collaborators. (C) Project Room view. Upload data files (arrow) and select files used for the analysis (arrowheads). (D) By clicking “Analysis” in the new window (arrow), the Maser screen automatically moves onto a list of analysis pipeline (E). (F) Option setting screen. There are two buttons, ‘Run’ to start the analysis (arrow) and “Set option and run” (arrowhead) to change the option setting. (G) Analysis status page. The Request ID (arrow) is assigned to each analysis. Arrowhead indicates ‘Reanalysis’ icon to repeat the analysis. Clicking the Request ID shows details of the analysis (H). (I) A representative example of RNA-seq pipeline analysis results, ‘TopHat2, CuffLinks2 and CummeRbund + GE’. This pipeline produces an html report that contains output files from all the embedded tools (e.g. TopHat, Cufflinks, CummeRbund) and visualized mapping results on GE (see Figure 3).


