Figure 3.
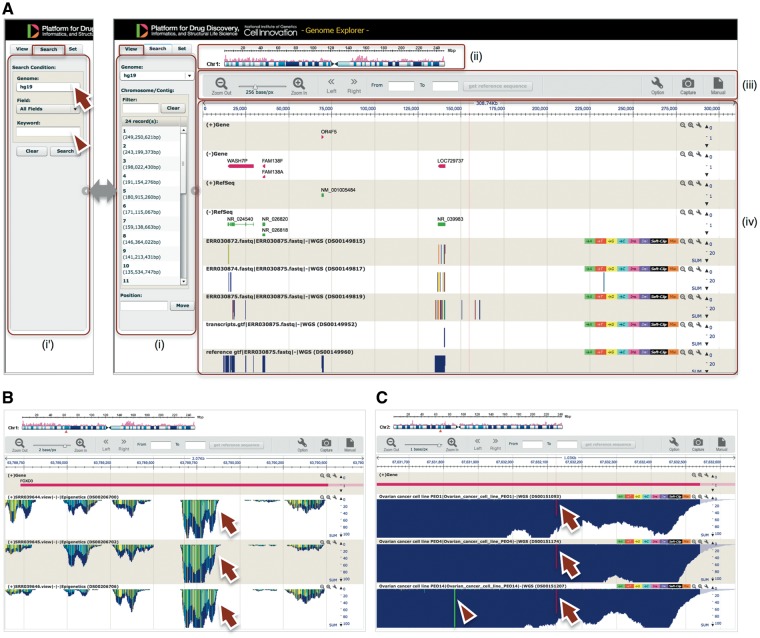
GE implemented on Maser. (A) GE display is composed of four components: (i) Genome box, (ii) Chromosome bar, (iii) Control menu bar and (iv) Mapping view. (i) The left Genome box shows a list of chromosomes or scaffolds of reference genomes the user has selected. The user can specify the chromosome and position to be displayed or search a specific gene by keywords (Entrez gene ID, Refseq ID, gene name and symbol) in the Search tab (i'). (ii) The top Chromosome bar shows the location in the chromosome displayed. (iii) The second top Control menu bar has multiple functions. There are buttons to zoom in and out of the chromosome, shift left or right on the chromosome region and retrieve any sequences in the range specified in the ‘From’ and ‘To’ boxes. The ‘Option’ button is used for selecting datasets displayed on the mapping view and changing plot format. (iv) The Mapping view is composed of multiple tracks that show the position of Entrez gene, Refseq transcripts, and mapping results. (B) Magnified mapping view with the detected methylation sites output from the BS-seq pipeline. The methylation patterns of all CpG, CHH and CHG regions throughout the genome are shown in cyan, green, and yellow, respectively (arrows). (C) Magnified mapping view with the detected SNVs and indels output from the Resequencing (Exome-seq) pipeline. The arrows and arrowhead indicate T variant (red vertical bar) and A variant (green vertical bar), respectively.

