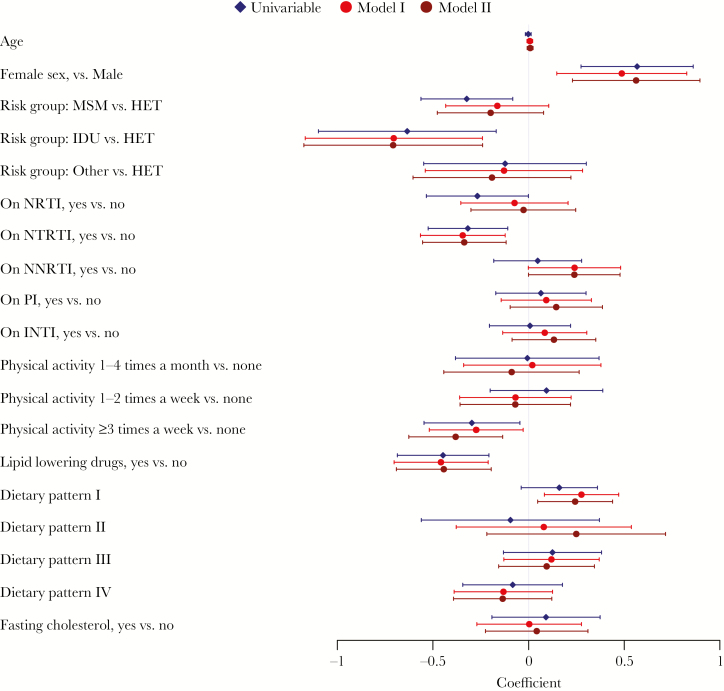
Figure 4.
Factors that correlate with total cholesterol, univariable and 2 linear mixed-effect models. Model I was adjusted for all the covariates in the figure. Model II was adjusted for all covariates in the figure and additionally for ethnicity, university education, living alone, smoking, depression, diabetes, hypertension, number of years on antiretroviral therapy, recent dietary change, multivitamin supplement, Omega 3 supplement, protein powder supplement. Dietary patterns consumption frequencies were ln(x+1) transformed. Pattern I: meat, refined/milled grains, carbonated beverages, coffee. Pattern II: organ meats, poultry, fish/seafood, alcohol. Pattern III: whole grains, dairy products, eggs, leafy green vegetables, other vegetables (raw and cooked), legumes/nuts/seeds, potatoes, boiled/mashed, pickled food, fruits, tea (black/green). Pattern IV: pizza, deep fried foods, salty snacks, ice cream/pudding, desserts/sweet snacks, confectionary sugars/syrups, fruit juice/drinks. Abbreviations: ART, antiretroviral therapy; HET, heterosexual; IDU, injecting drug users; INTI, integrase inhibitor; MSM, men who have sex with men; NNRTI, nonnucleoside reverse-transcriptase inhibitor; NRTI, nucleoside reverse-transcriptase inhibitor; NTRTI, nucleotide reverse-transcriptase inhibitor; PI, protease inhibitor.

