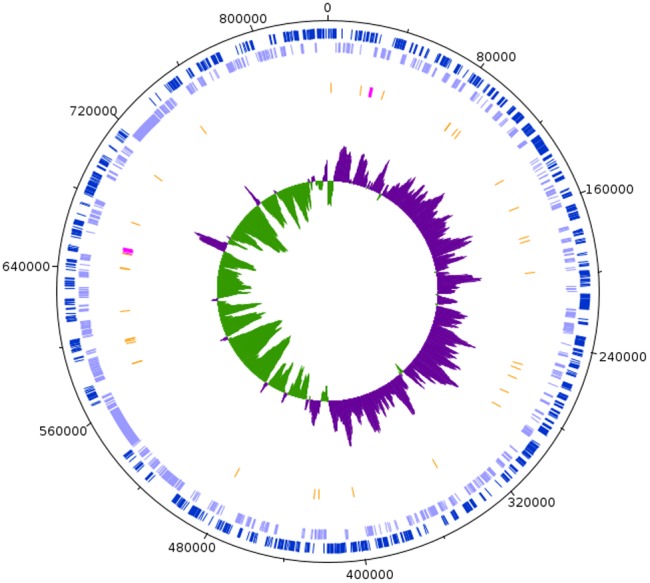
Fig. 1.

—Graphical representation of the genome of Fokinia solitaria. Circles, from the outermost to the innermost show, respectively, coding sequences (CDSs) on the plus strand in light blue; CDSs on the minus strand in green; tRNAs in orange and rRNAs in fuchsia; the GC skew, positive in green, negative in purple. Position 1 was arbitrarily set as the start of the dnaA gene.
