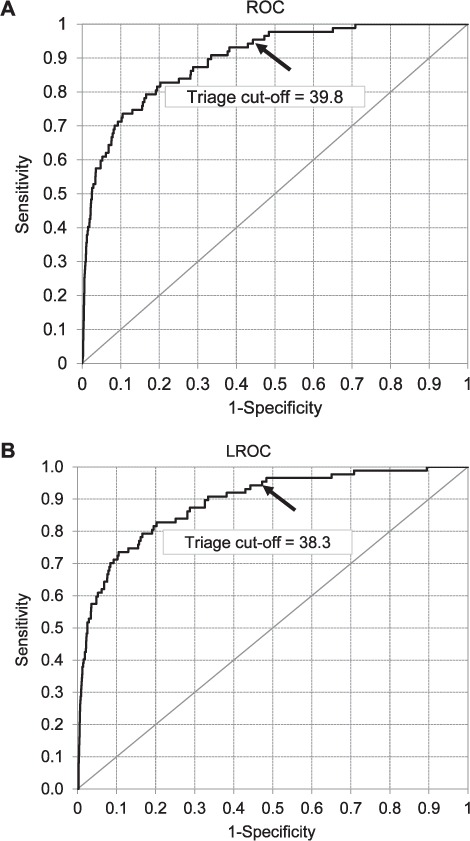
Figure 2.

ROC and LROC curve analyses of CAD performance in discriminating between active TB and non-active TB cases. The triage cut-off point at 95% sensitivity is indicated by an arrow. Cases to the left of the cut-off point would be referred for human reading, whereas cases to the right would be excluded from further analysis. ROC = receiver operating characteristic; LROC = localisation ROC; CAD = computer-aided detection; TB = tuberculosis.
