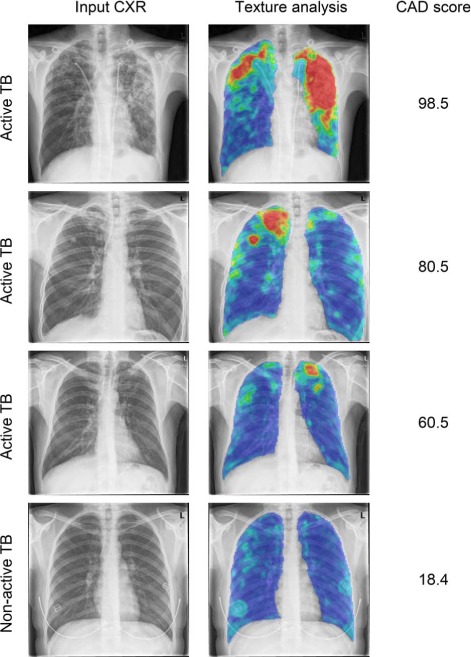
Figure 3.

Examples of CAD analysis. First column: input CXR; second column: heat map resulting from texture analysis (colours indicate low-to-high suspicion of abnormality in the following order: blue-green-yellow-orange-red), last column: TB score assigned by CAD ranging from 0 (normal) to 100 (abnormal). CXR = chest radiograph; TB = tuberculosis; CAD = computer-aided detection. This image can be viewed online in colour at http://www.ingentaconnect.com/content/iuatld/ijtld/2018/00000022/00000005/art000...
