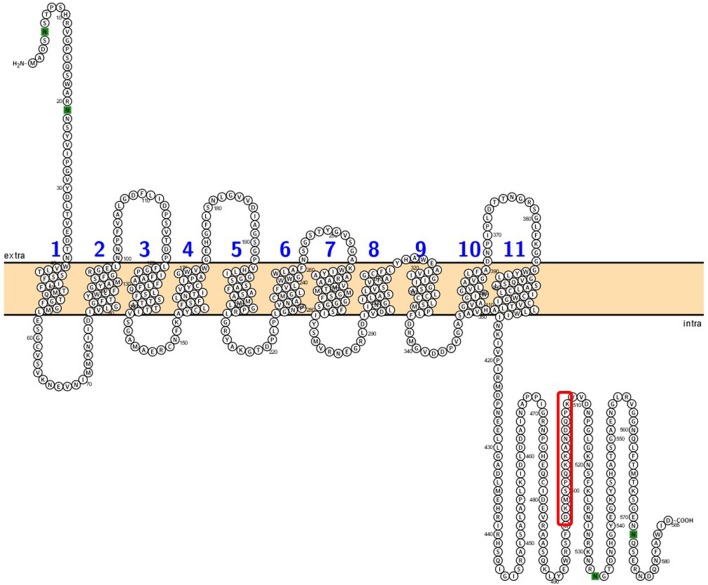
Figure 3.
Amino acid plot of Aedes aegypti AeAmt2. The plot of predicted sequence features of AeAmt2 depicts 11 transmembrane domains, an extracellular (extra) N-terminus and an intracellular (intra) C-terminal region. Amino acids highlighted in green represent N-glycosylation sites. The amino acid sequence boxed in red represents the epitope used to generate the custom AeAmt2 antibody used in this study (see section Materials and Methods).

