Figure 7.

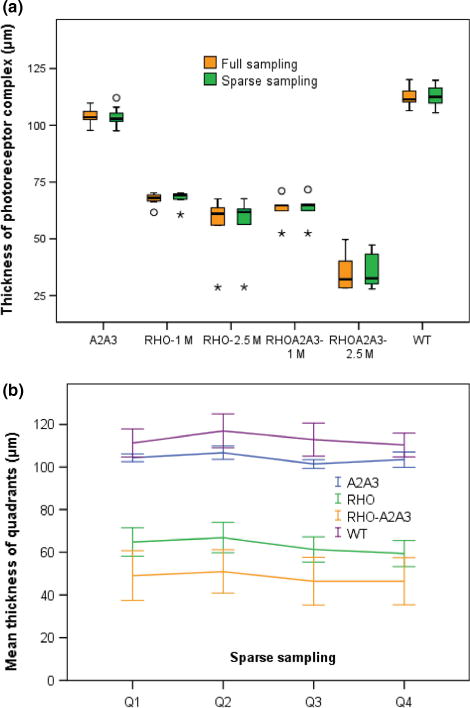
(a) Thickness measure outcomes from full analysis of all B-scans vs sparse sampling at 4 points 90° apart in each eye. Circle symbols denote outliers between 1.5× and 3× interquartile range, and stars denote outliers >3× interquartile range. For mouse lines Rho−/−and Rho−/−A2−/−A3−/−, plots are split by age group as there were apparent progressive reductions in thickness. (b) Similar to the full sampling data as shown in Figure 6, sparse sampling also revealed uneven thickness across quadrants. Error bars indicate 95% confidence intervals.
