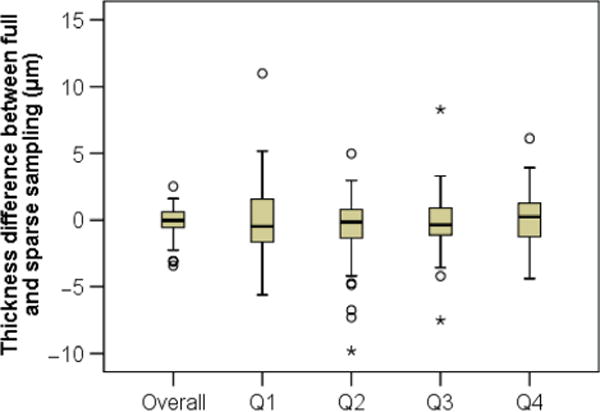
Figure 8.

Difference in thickness measurement between full and sparse sampling methods. Comparing average thickness for each quadrant and thickness measure based on one point sampling, there was a good chance to observe a difference of several microns. Comparing overall thickness based on full sampling and average of 4 point sampling, the difference became smaller. Circle symbols denote outliers between 1.5× and 3× interquartile range, and stars denote outliers >3× interquartile range.
