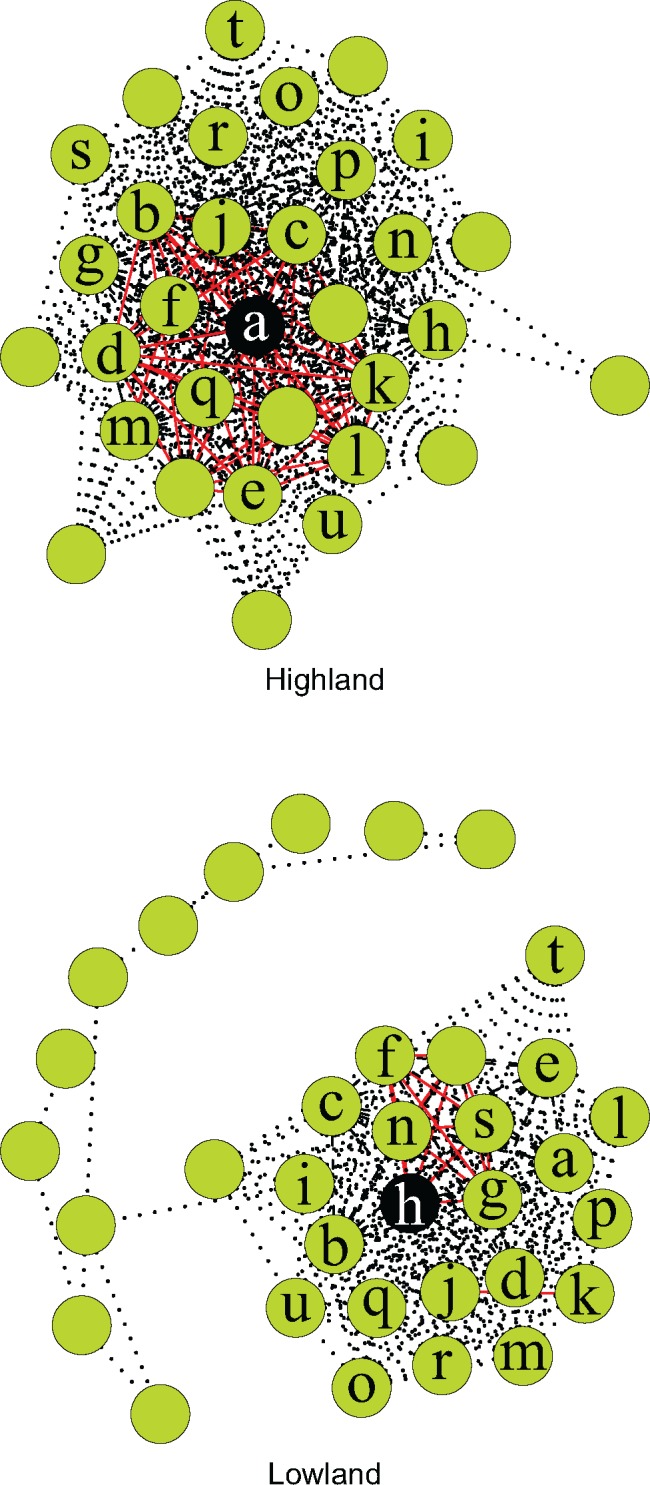
Fig. 2.

—Linkage disequilibrium network plot of sex-linked clusters from the highland and lowland populations of Niveoscincus ocellatus. Green circles indicate sex-linked SNPs (n = 32 in the highland, n = 34 in the lowland populations); “a”–“u” denote 21 loci sex-linked in both the highland and lowland population. The perfectly sex-linked locus for each cluster is in black. Red solid edges have an R2 > 0.99, black dashed 0.99 > R2 > 0.80, gray dotted R2 < 0.80.
