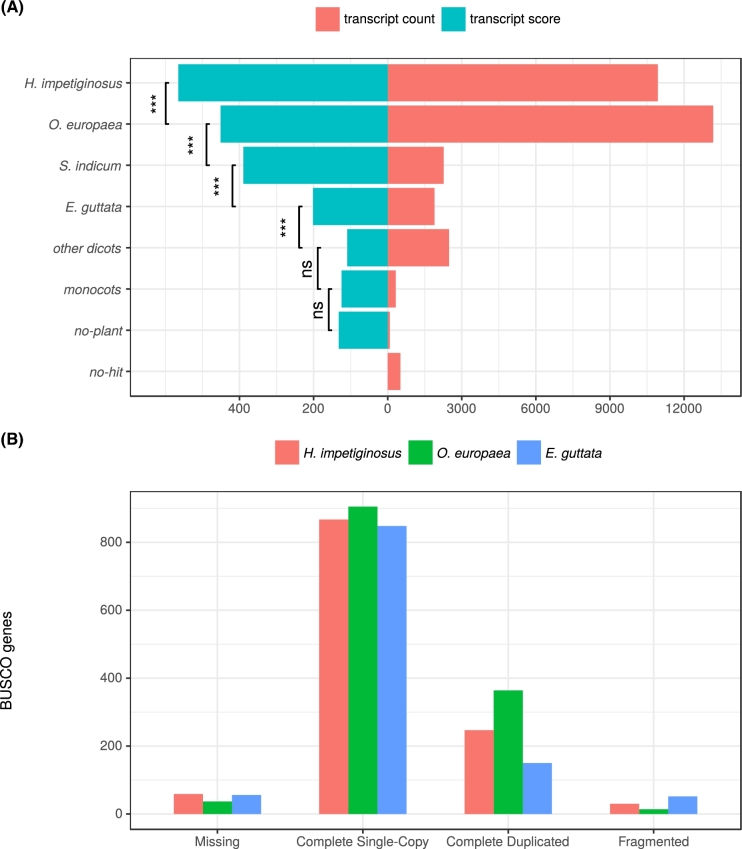
Figure 6:
Transcriptome quality assessment (A) similarity search of H. impetiginosus putative peptides against source database of plant protein sequences using BLASTP algorithm (e-value = 1e-6). Transcript count means the number of peptides of H. impetiginosus with the best hit against the source database using bit-score and grouping results by taxon name. Transcript score corresponds to the average bit-score overall hits for each group using the best hit. We ordered taxon groups by their average bit-score overall hits and used Welch's t test to compare the distributions of bit-score hits between 2 adjacent groups with P-values <0.01 (ns = nonsignificant; *significant). (B) Completeness of the expected gene space of the genome assembly, estimated with BUSCO. The estimates were compared with genome annotations for other lamids, Erythranthe guttata and Olea europaea.

