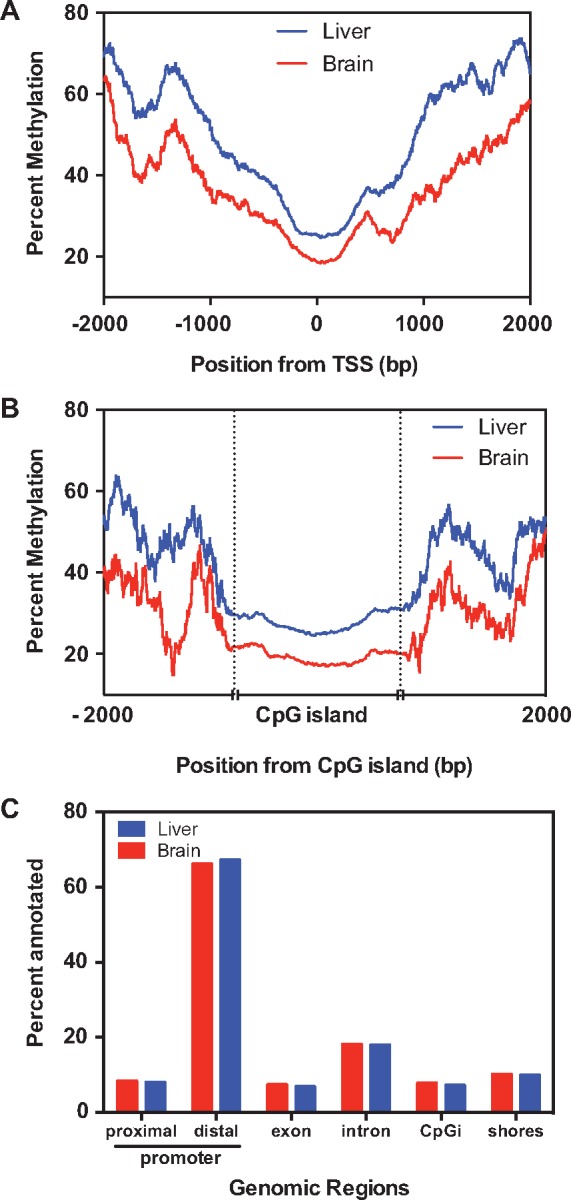
Figure 2:

Tissue-specific DNA methylation profiles and their genomic location. Percentage of methylation levels in the proximal promoter regions (A) and CpG islands (B) in the liver and brain are plotted. (C) Percentage of 300 bp tiles overlapping with different genomic regions. These plots are based on the tiles represented in all samples. Proximal (up to 5 kb upstream) and distal promoter (>5 kb) regions are classified based on the distance from the transcriptional start site
