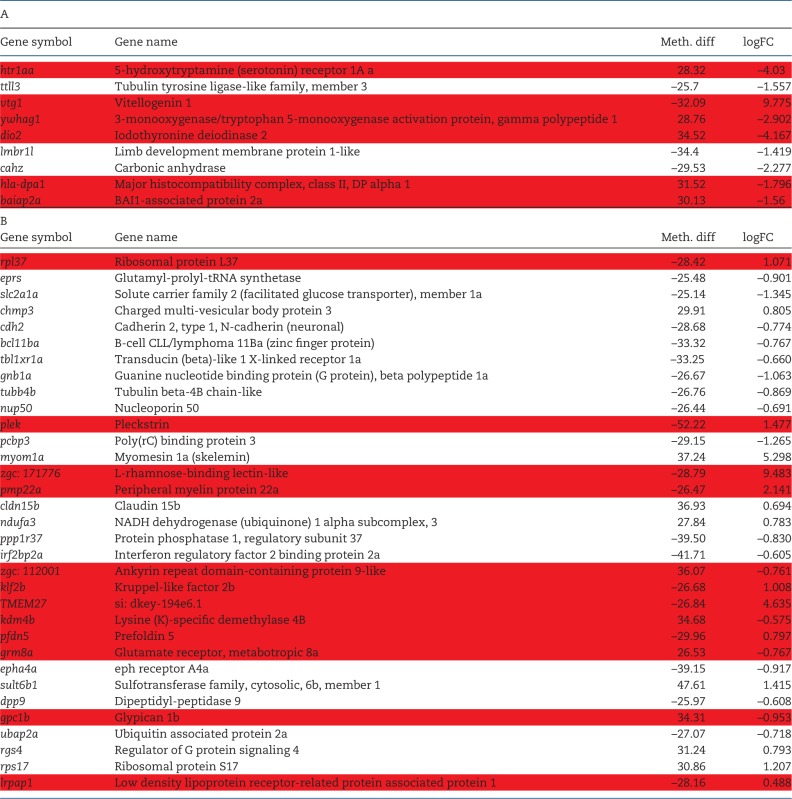
Table 4:
Relationship between DMRs and DEGs (A) List of genes in the liver (A) and brain (B) that are both differentially methylated and differentially expressed. Spearman correlation coefficient was not statistically significant (r2 = 0.2719 for liver and 0.0078 for brain). There is an inverse relationship between DNA methylation (Meth. diff) and gene expression (logFC) for the genes highlighted in red
 |
