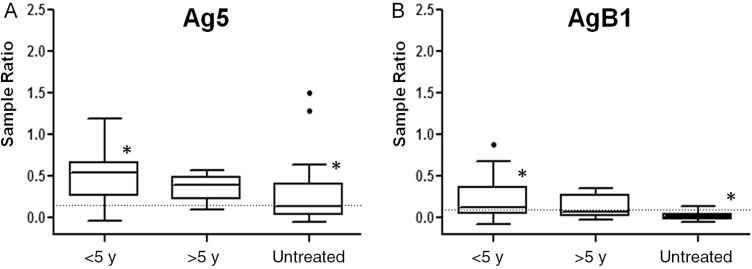
Figure 8.
Box-and-whiskers plots of enzyme-linked immunosorbent assay results for antigen 5 (Ag5) (A) and antigen B1 (AgB1) (B) setups. Boxes represent values falling within the 25th and 75th percentiles (interquartile range [IQR]); central lines, median values; whiskers, values falling within ±1.5 IQR; single dots, values falling outside the whiskers; dashed lines, best cutoff values. *Significantly different after Kruskal-Wallis test, coupled to Conover test, with Bonferroni correction, for multiple comparisons (P < .02).

