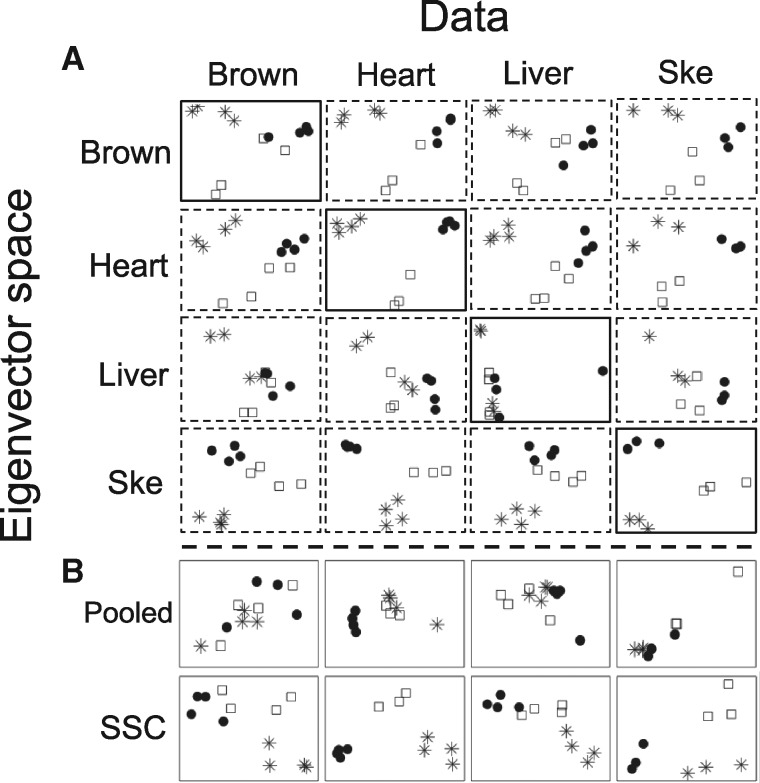
Fig. 1.
Dimension reduction via (A) individual study PCA and (B) MetaPCA (SSC), over the four mouse metabolism transcriptomic studies. The x-axis and y-axis refer to the first and second principal component projection. Solid circle, star and square symbols indicate wild-type (WT), very longchain acyl-coenzyme A dehydrogenase (VLCAD), and longchain acyl-coenzyme A dehydrogenase (LCAD) mutations, respectively. Brown represents brown fat tissue and Ske represents skeleton tissue

