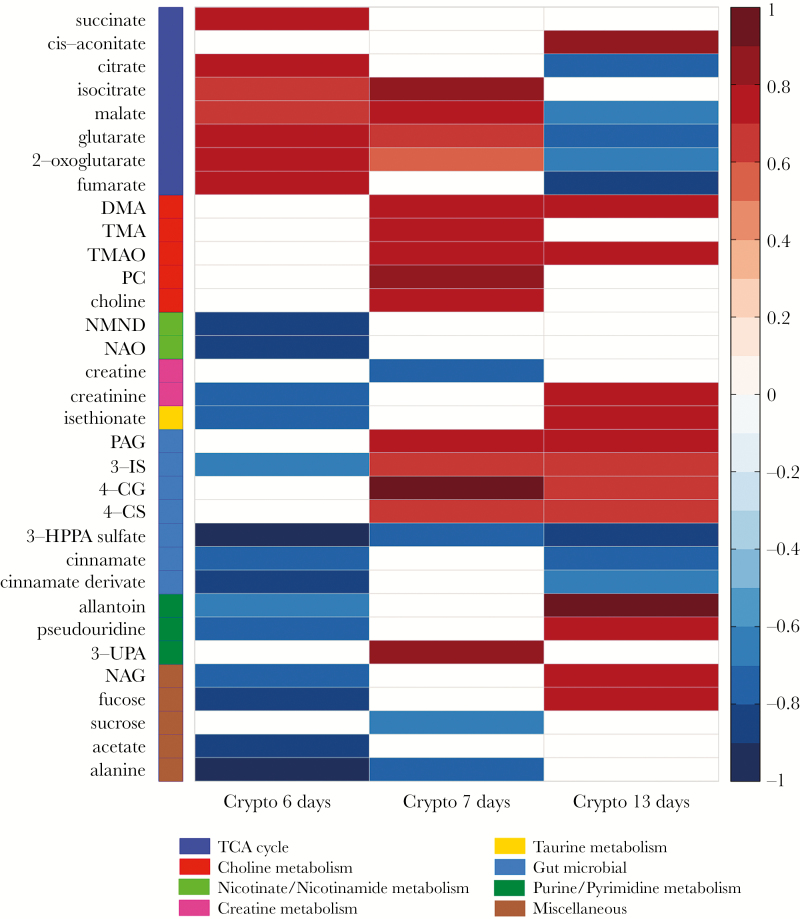
Figure 2.
Heatmap summary of the Crypto-induced urinary metabolic alterations identified by the OPLS-DA models. The color (ranging from –1 dark blue to +1 dark red) indicates the correlation coefficient (R) of Crypto at 6, 7, and 13 days postinfection compared with diet-(protein deficient) and age-matched uninfected controls. Metabolic grouping are indicated by color code on the left with the group color key below. n = 5/7 at day 6; n = 5/6 at day 7; and n = 4/7 at day 13 postinfection (uninfected/infected). Abbreviations: 3-IS, 3-indoxyl sulfate; 3-UPA, 3-ureidopropionic acid; 4-CG, 4-cresol glucuronide; 4-CS, 4-cresyl sulfate; DMA, dimethylamine; 3-HPPA sulfate, 3-hydroxy-phenyl propionic acid sulfate; NAG, N-acetyl glycoproteins; NAO, nicotinamide-N-oxide; NMND, N-methylnicotinamide; PAG, phenylacetylglycine; PC, phosphocholine; TMA, trimethylamine; TMAO, trimethylamine-N-oxide.

