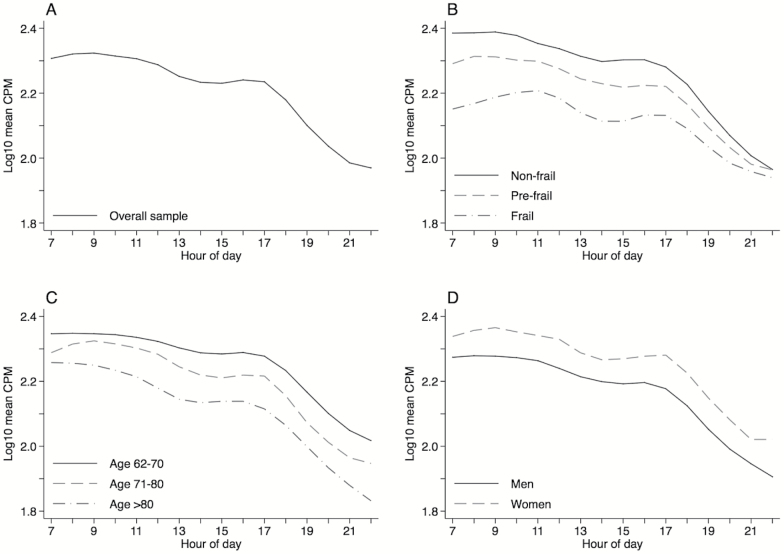
Figure 1.
Multivariate mixed effects linear regression models fit with a penalized spline for hour of day and adjusted for frailty, age, gender, body mass index, race/ethnicity, working status, cognitive function, comorbidity burden, month of wear, day of week, hour of day, and survey design were used to plot the average change in mean hourly CPM during wake hours between 7:00 am and 10:59 pm among older U.S. adults. Activity curves are plotted separately for the overall sample (A) and by frailty status (B), age category (C), and gender (D).

