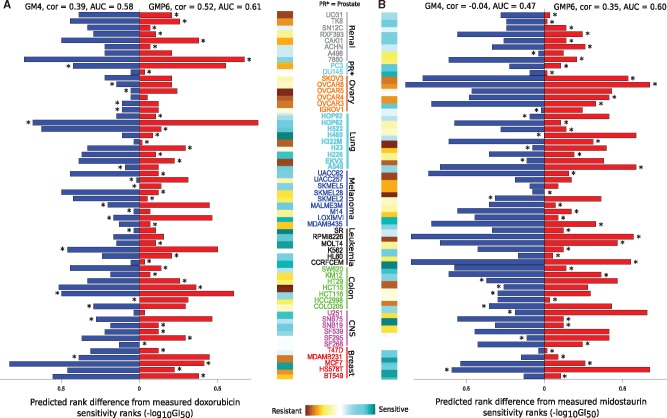
Fig. 4.
Ranked cell-specific prediction of (A) doxorubicin and (B) midostaurin response using the baseline GM4 and best GMP6 model. Value x = 0 is set to equal rank for both the measured and predicted drug responses. Asterisk indicates the case closer to the measured rank for a particular cell line. Color bar quantifies the measured cell line drug sensitivity responses (GI50). ROC-AUC calculation was based on quantile value of 0.55

