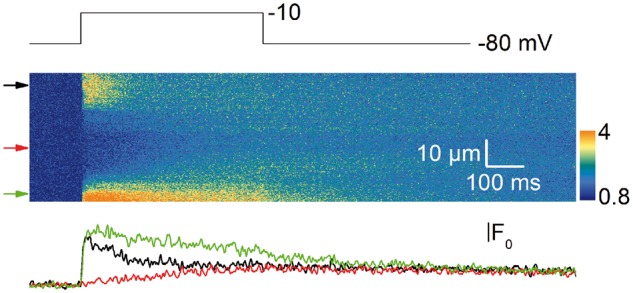
Figure 7.

Line-scan image of Ca2+ transient from a KO fiber. Example of line-scan image of rhod-2 Ca2+ transient from a KO fiber yielding a large region of severely depressed Ca2+ release. Traces on the bottom show the changes in fluorescence at the positions indicated by the arrows on the left side of the rhod-2 image.
