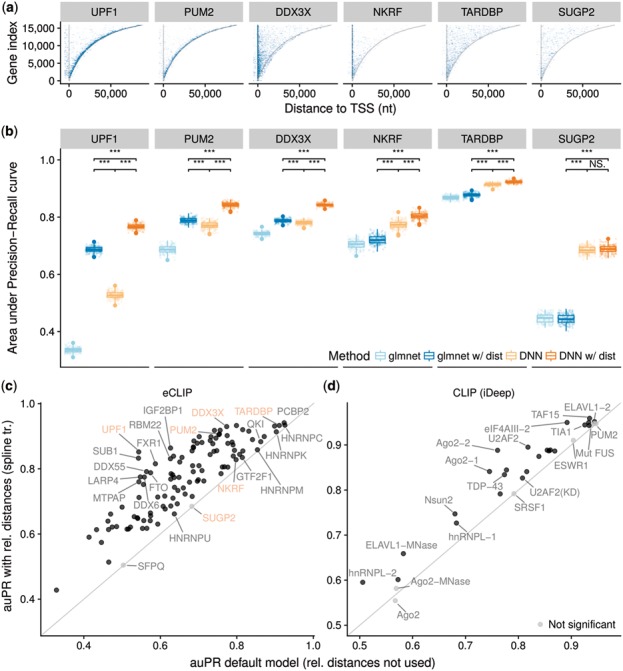
Fig. 2.

Relative distance to genomic landmarks boosts the in vivo prediction of RBP binding sites. (a) eCLIP peak distribution across all genes. Genes (y-axis) are sorted by their length and aligned at their start site. Color intensity represents the number of peaks per bucket (100 genes × 1000 nt) and saturates at 10 peaks per bucket. Grey lines represent gene TSS and poly(A) site. (b) auPR for predicting in vivo RBP binding sites measured by eCLIP for a subset of RBPs (6/112). Methods labelled by ‘w/dist’ rely, in addition to RNA sequence, on two positional features: distance to TSS and poly(A) site. Distribution of the auPR metric (boxplot instead of point-estimate) is obtained by generating 200 bootstrap samples of the test set and computing auPR for each of them. *** denotes P < 0.001 (Wilcoxon test). (c and d) Benefit of adding eight genomic landmark features with spline transformation to the (c) DNN model for all 112 RBPs measured by eCLIP in ENCODE and (d) iDeep model (Pan and Shen, 2017) for 19 RBPs across 31 CLIP experiments. Black represents statistically significant difference (P < 0.0001, Wilcoxon test on 200 bootstrap samples, Bonferroni correction for multiple testing)
