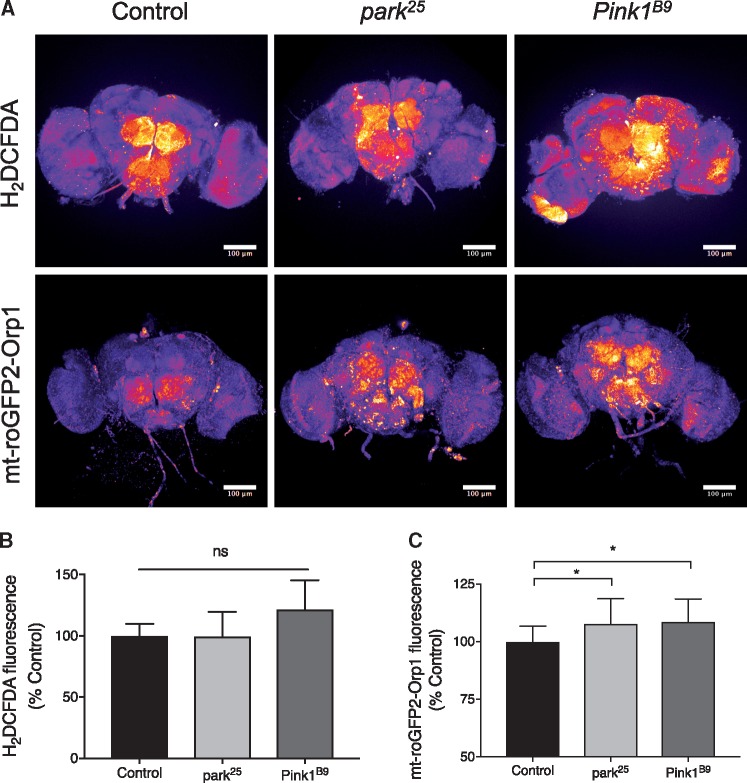
Figure 6.
Analysis of redox state in Pink1 and parkin deficient flies. (A) Pseudocolour representative images of adult Drosophila brains imaging cytosolic (H2DCFDA) or mitochondrial (mt-roGFP2-Orp1) ROS reporters in control (w1118), park25 or Pink1B9 adult brains. Scale bars = 100 µm. (B) Quantification of cytosolic (H2DCFDA) ROS normalised to control; control n = 10, park25 n = 9 and Pink1B9 n = 9. (C) Quantification of mitochondrial (mt-roGFP2-Orp1) ROS normalised to control; control n = 16, park25 n = 20 and Pink1B9 n = 16. Charts show mean ± SD. Statistical analysis used Kruskal–Wallis with Dunn’s multiple comparisons test (*P < 0.05; ns, non-significant).

