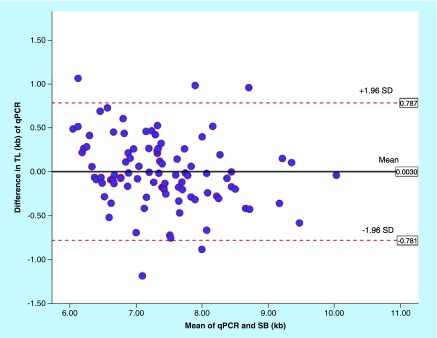
Figure 6. . Bland–Altman agreement between monochrome multiplex quantitative polymerase chain reaction (kilobyte) and Southern blot (kilobyte) analysis for leukocyte telomere length.
Bland–Altman plot for agreement analysis of quantitative polymerase chain reaction (kilobyte) and Southern blot analysis (kilobyte). The bias was 0.003 kb and limits of agreement ranged from -0.781 to 0.787 kb.
qPCR: Quantitative polymerase chain reaction; SB: Southern blot; SD: Stansard deviation; TL: Telomere length.

