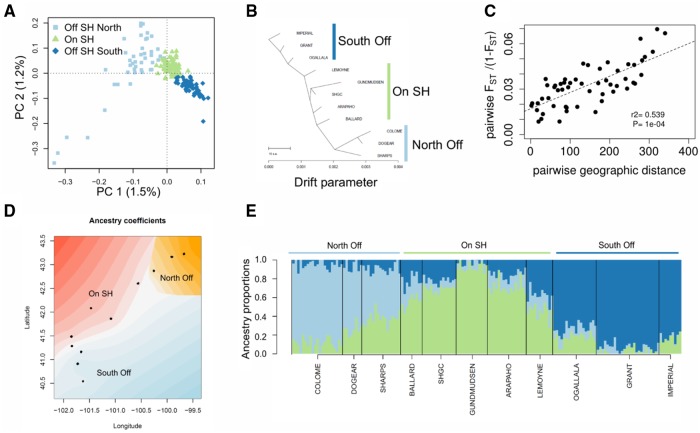
Fig. 4.
Genetic structure of populations on and off the Sand Hills. (A) PCA shows that individuals cluster according to their geographic sampling location, with a clear separation of individuals sampled on the Sand Hills (SH; green) from off the Sand Hills (blue). (B) TreeMix results for the tree that best fit the covariance in allele frequencies across samples. (C) An isolation-by-distance model is supported by a significant correlation between pairwise genetic differentiation (FST/[1 − FST]) and pairwise geographic distance among sampling sites. Significance of the Mantel test was assessed through 10,000 permutations. (D) Spatial interpolation of the ancestry proportion inferred, accounting for geographic sampling location, using TESS3 for K = 3 groups. Individuals are represented as dots, and the ancestry of the three groups is represented by a gradient of three colors. (E) Individual admixture proportions (inferred using TESS3) are consistent with IBD and reduced differentiation among populations. The number of clusters (K) best explaining the data was assessed as the K value reaching the lowest minimal cross-entropy at K = 3. All analyses were based on a subset of 161 individuals showing a mean depth of coverage larger than 8×, with all genotypes possessing a minimum coverage of 4×, sampling one SNP for each 1.5-kb block, resulting in a data set with 5,412 SNPs (supplementary table 8, Supplementary Material online).

